Nassau & Paradise Island Market Report - February 2025

Morley
We're Morley, a real estate company owned and operated by Bahamians with experience spanning four generations...
We're Morley, a real estate company owned and operated by Bahamians with experience spanning four generations...
Our monthly Market Report provides meaningful and valuable information, to empower buyers and sellers who are considering a real estate transaction in Nassau or Paradise Island (Bahamas).
If you're considering selling your property or buying property on Nassau or Paradise Island, it's essential to understand what's happening in The Bahamas' real estate market. Knowing the most important data, such as median and average prices, the number of properties sold, the number of new listings, and the days on the market will better prepare you for selling or buying.
We are happy to share our February 2025 analysis of the Nassau and Paradise Island market. We also encourage you to review our quarterly market reports on Abaco, Eleuthera, Exuma, Grand Bahama and New Providence.
Our market reports provide Morley's interpretation of the data from the Bahamas Real Estate Association MLS. Even though the MLS does not include all real estate sales and related real estate data, we believe the MLS data is reasonable and consistent to be reliable to use to estimate local real estate trends.

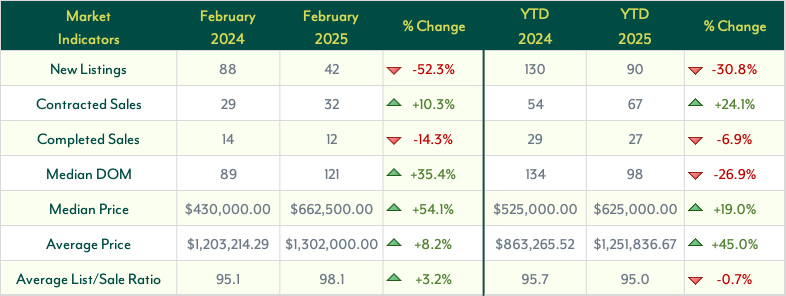
The Nassau and Paradise Island housing market in February 2025 showed a mix of tightening inventory, strong demand, and rising prices.
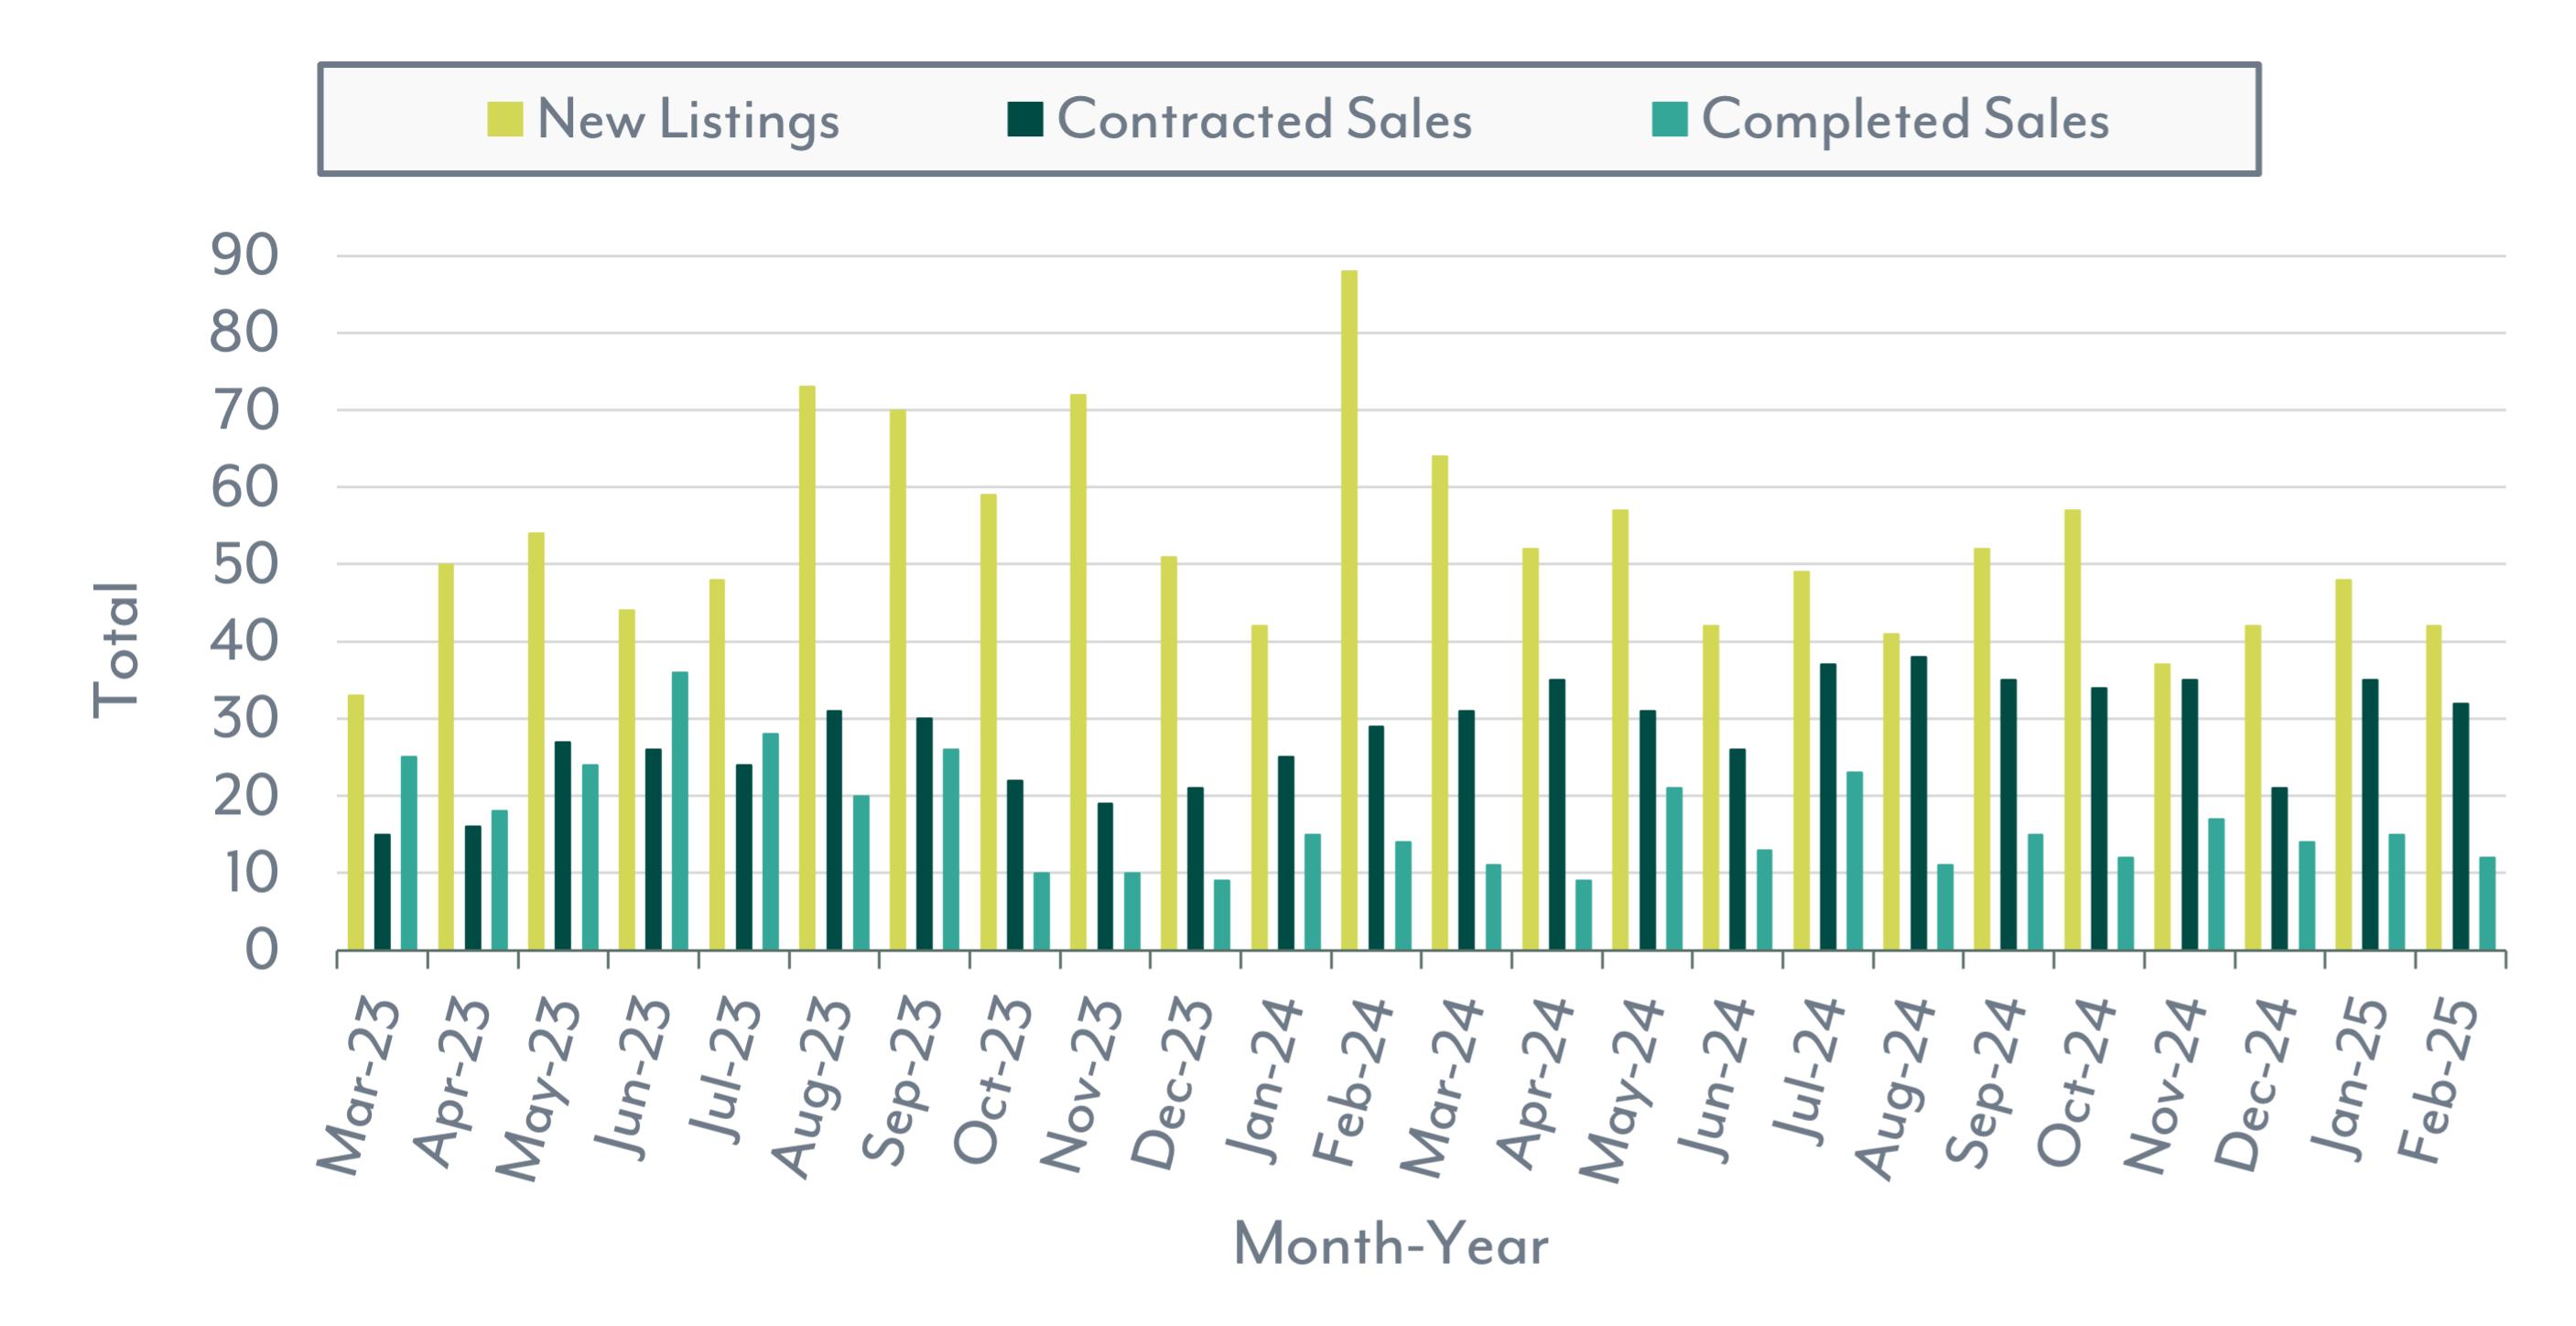
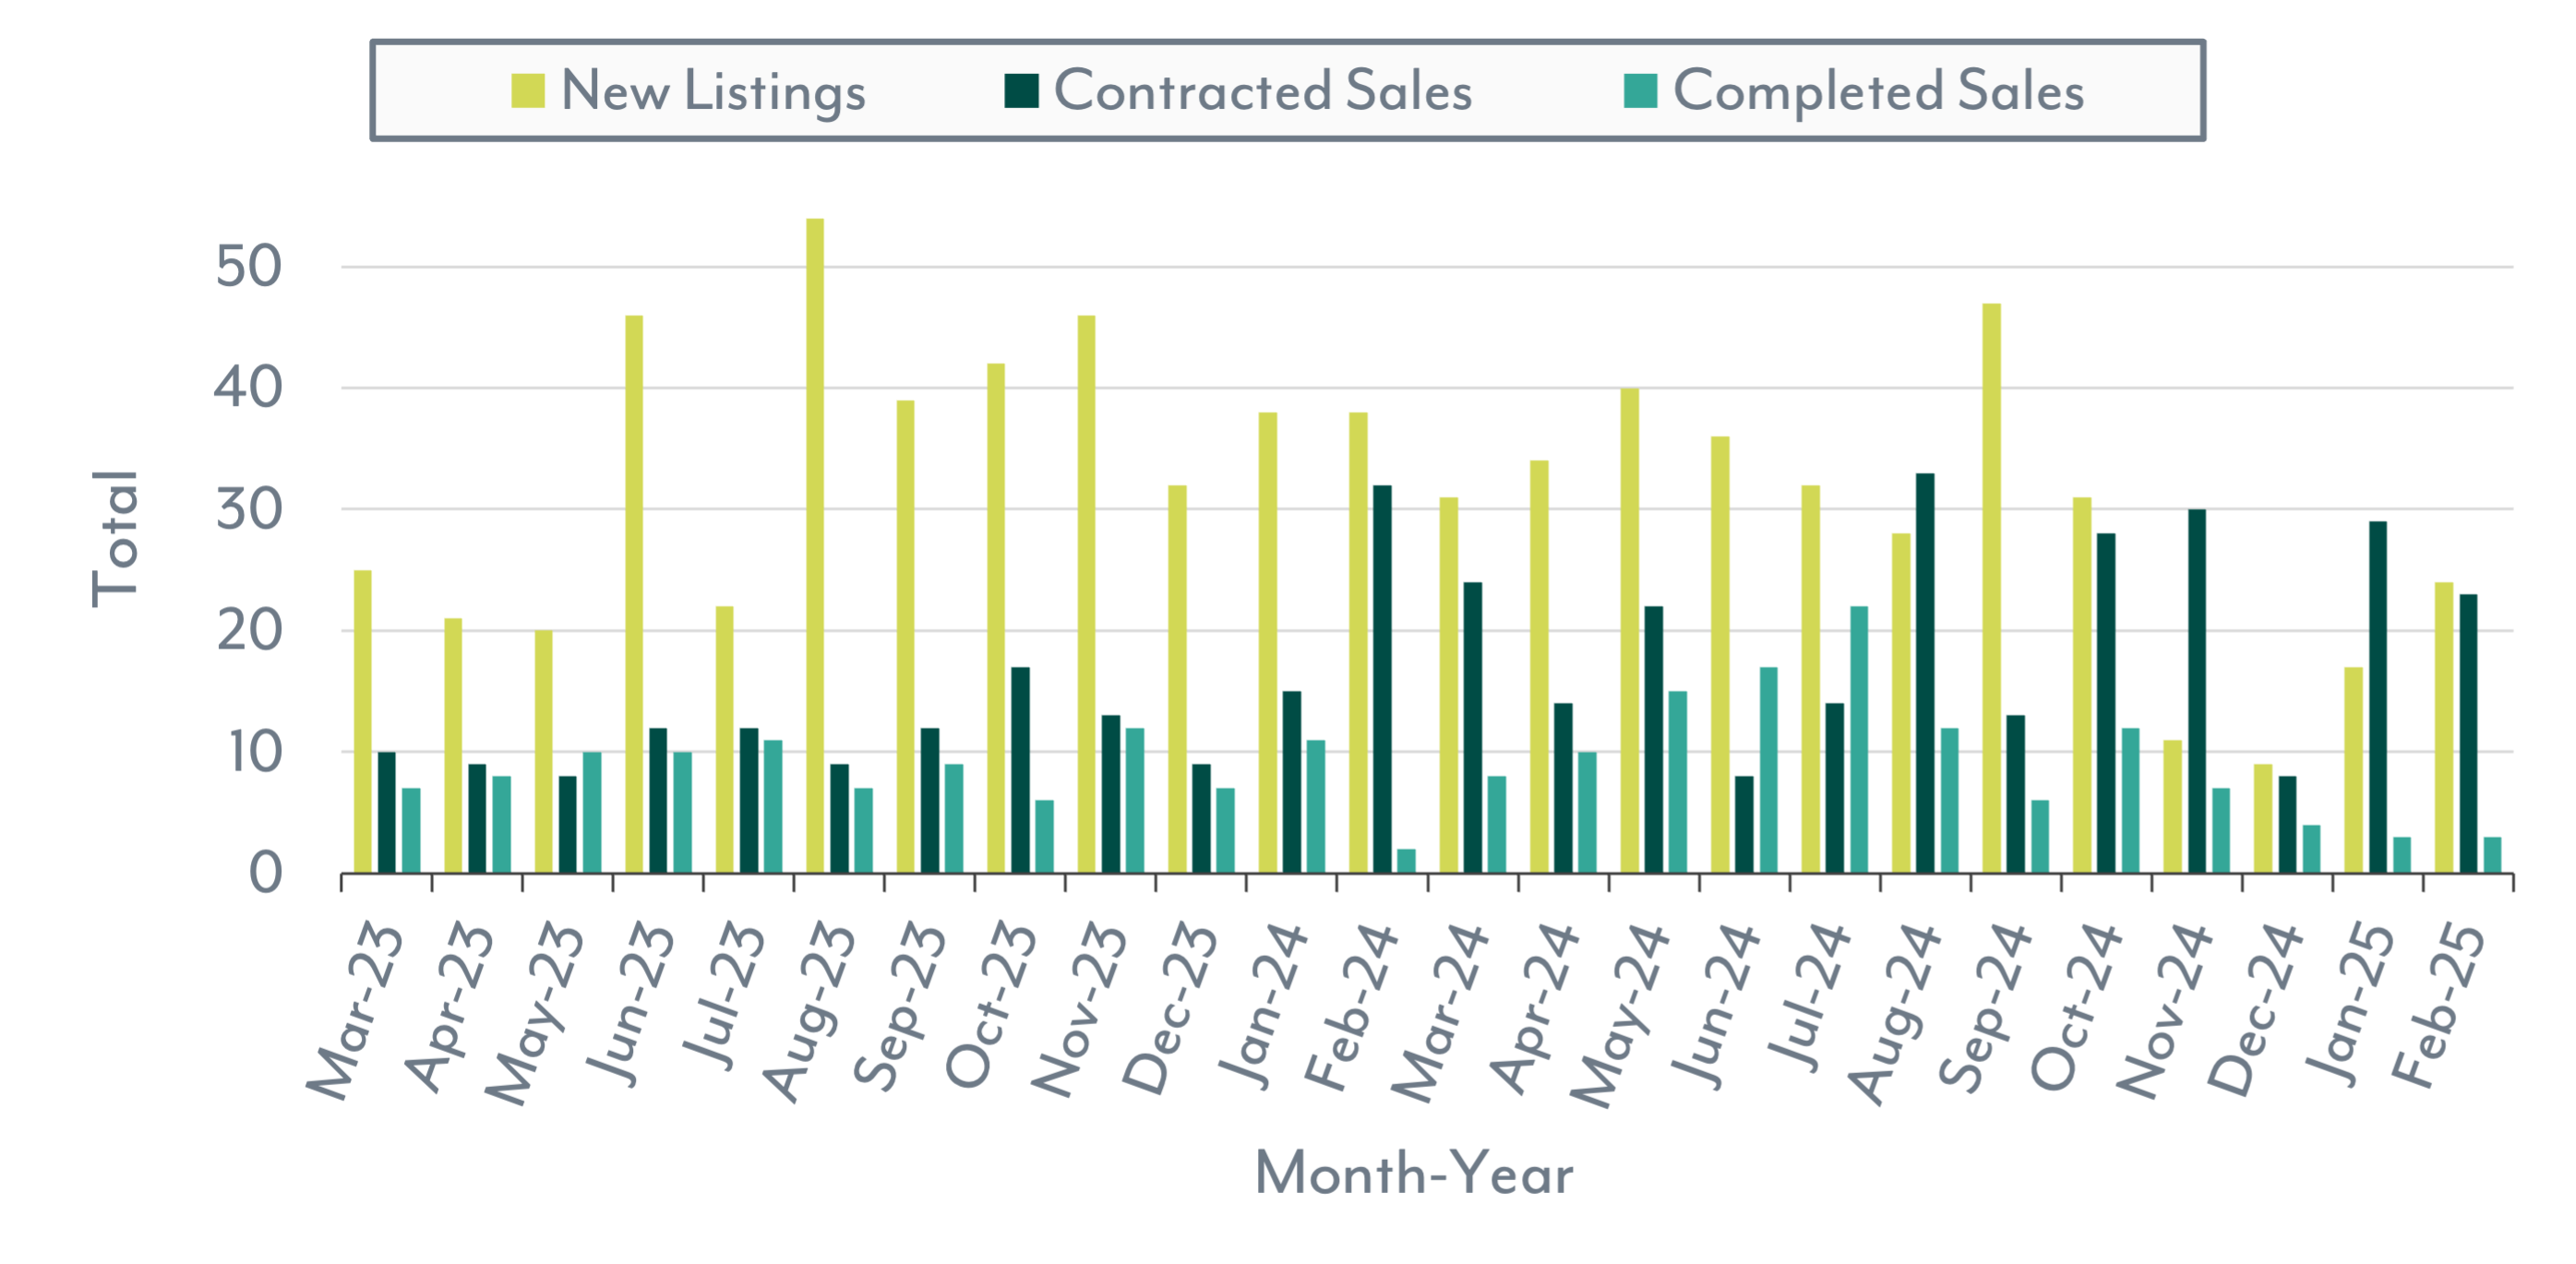
New Listings dropped significantly by 52.3% year-over-year (YoY) to 42 properties, highlighting a shrinking supply and increased buyer competition. Year-to-date (YTD), listings fell 30.8%, reinforcing concerns about limited inventory.
Despite fewer new listings, demand remained resilient. Contracted Sales rose 10.3% YoY to 32, indicating buyer interest is still strong. YTD growth of 24.1% further supports this trend. However, Completed Sales declined by 14.3% YoY to 12, with a YTD decrease of 6.9%, reflecting delays in transaction finalizations.
Median Days on Market (DOM) increased 35.4% YoY to 121 days, suggesting homes are taking longer to sell. However, YTD, DOM improved by 26.9%, signaling greater efficiency in overall market performance.
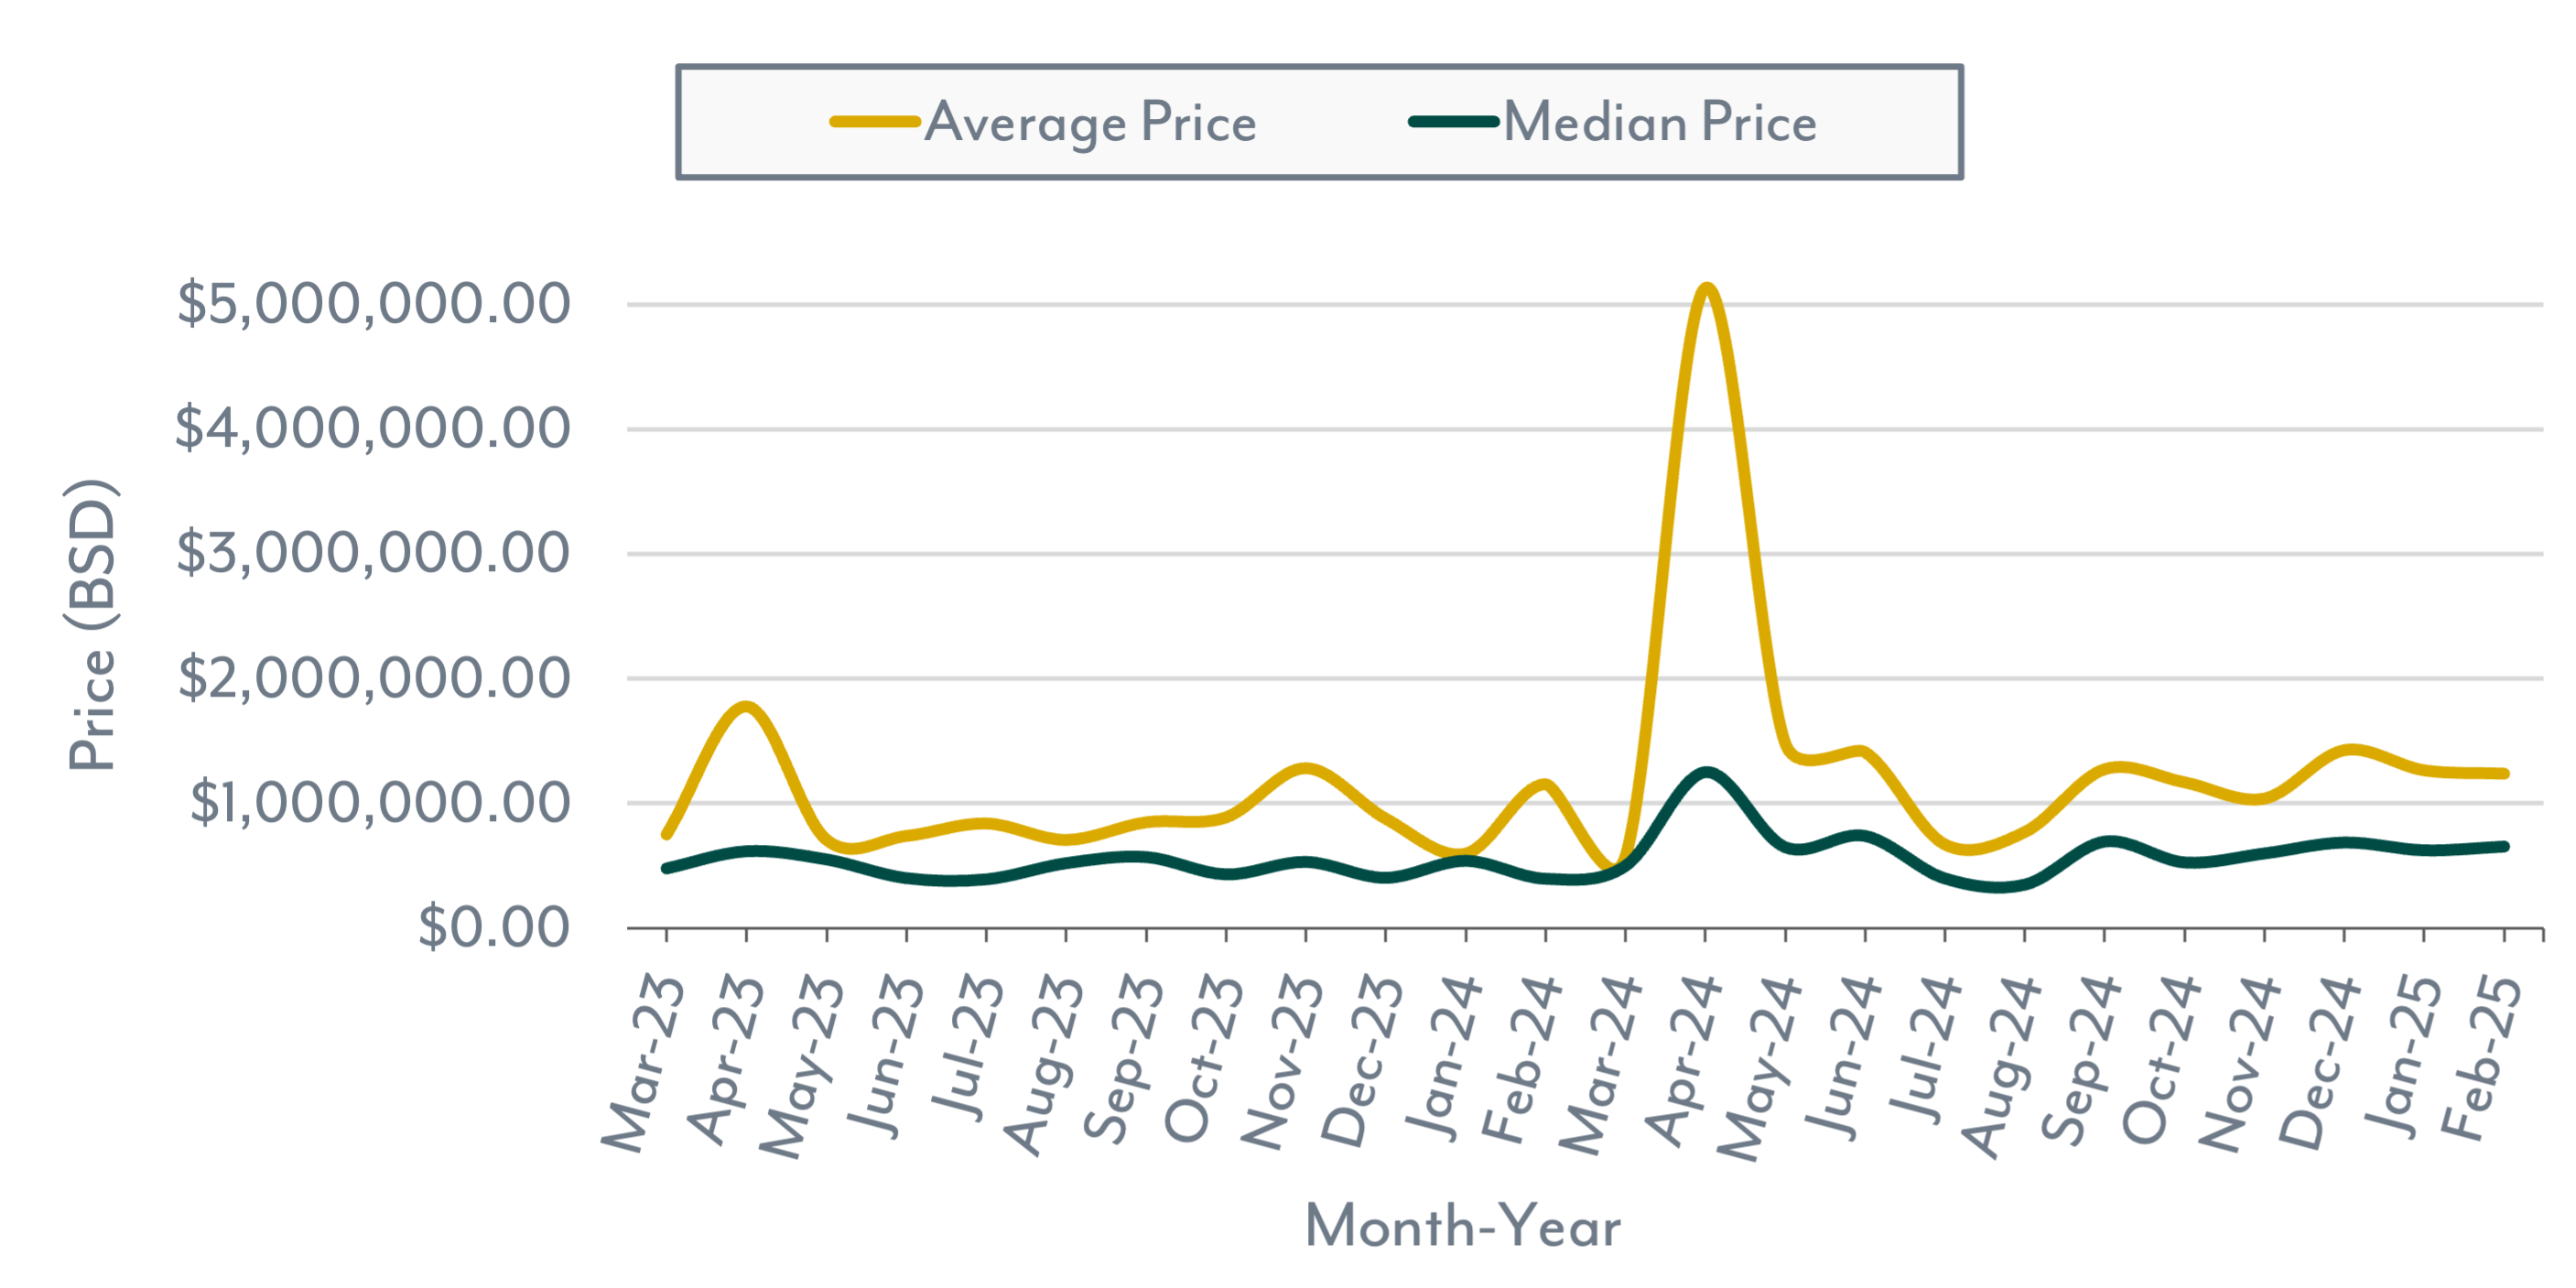
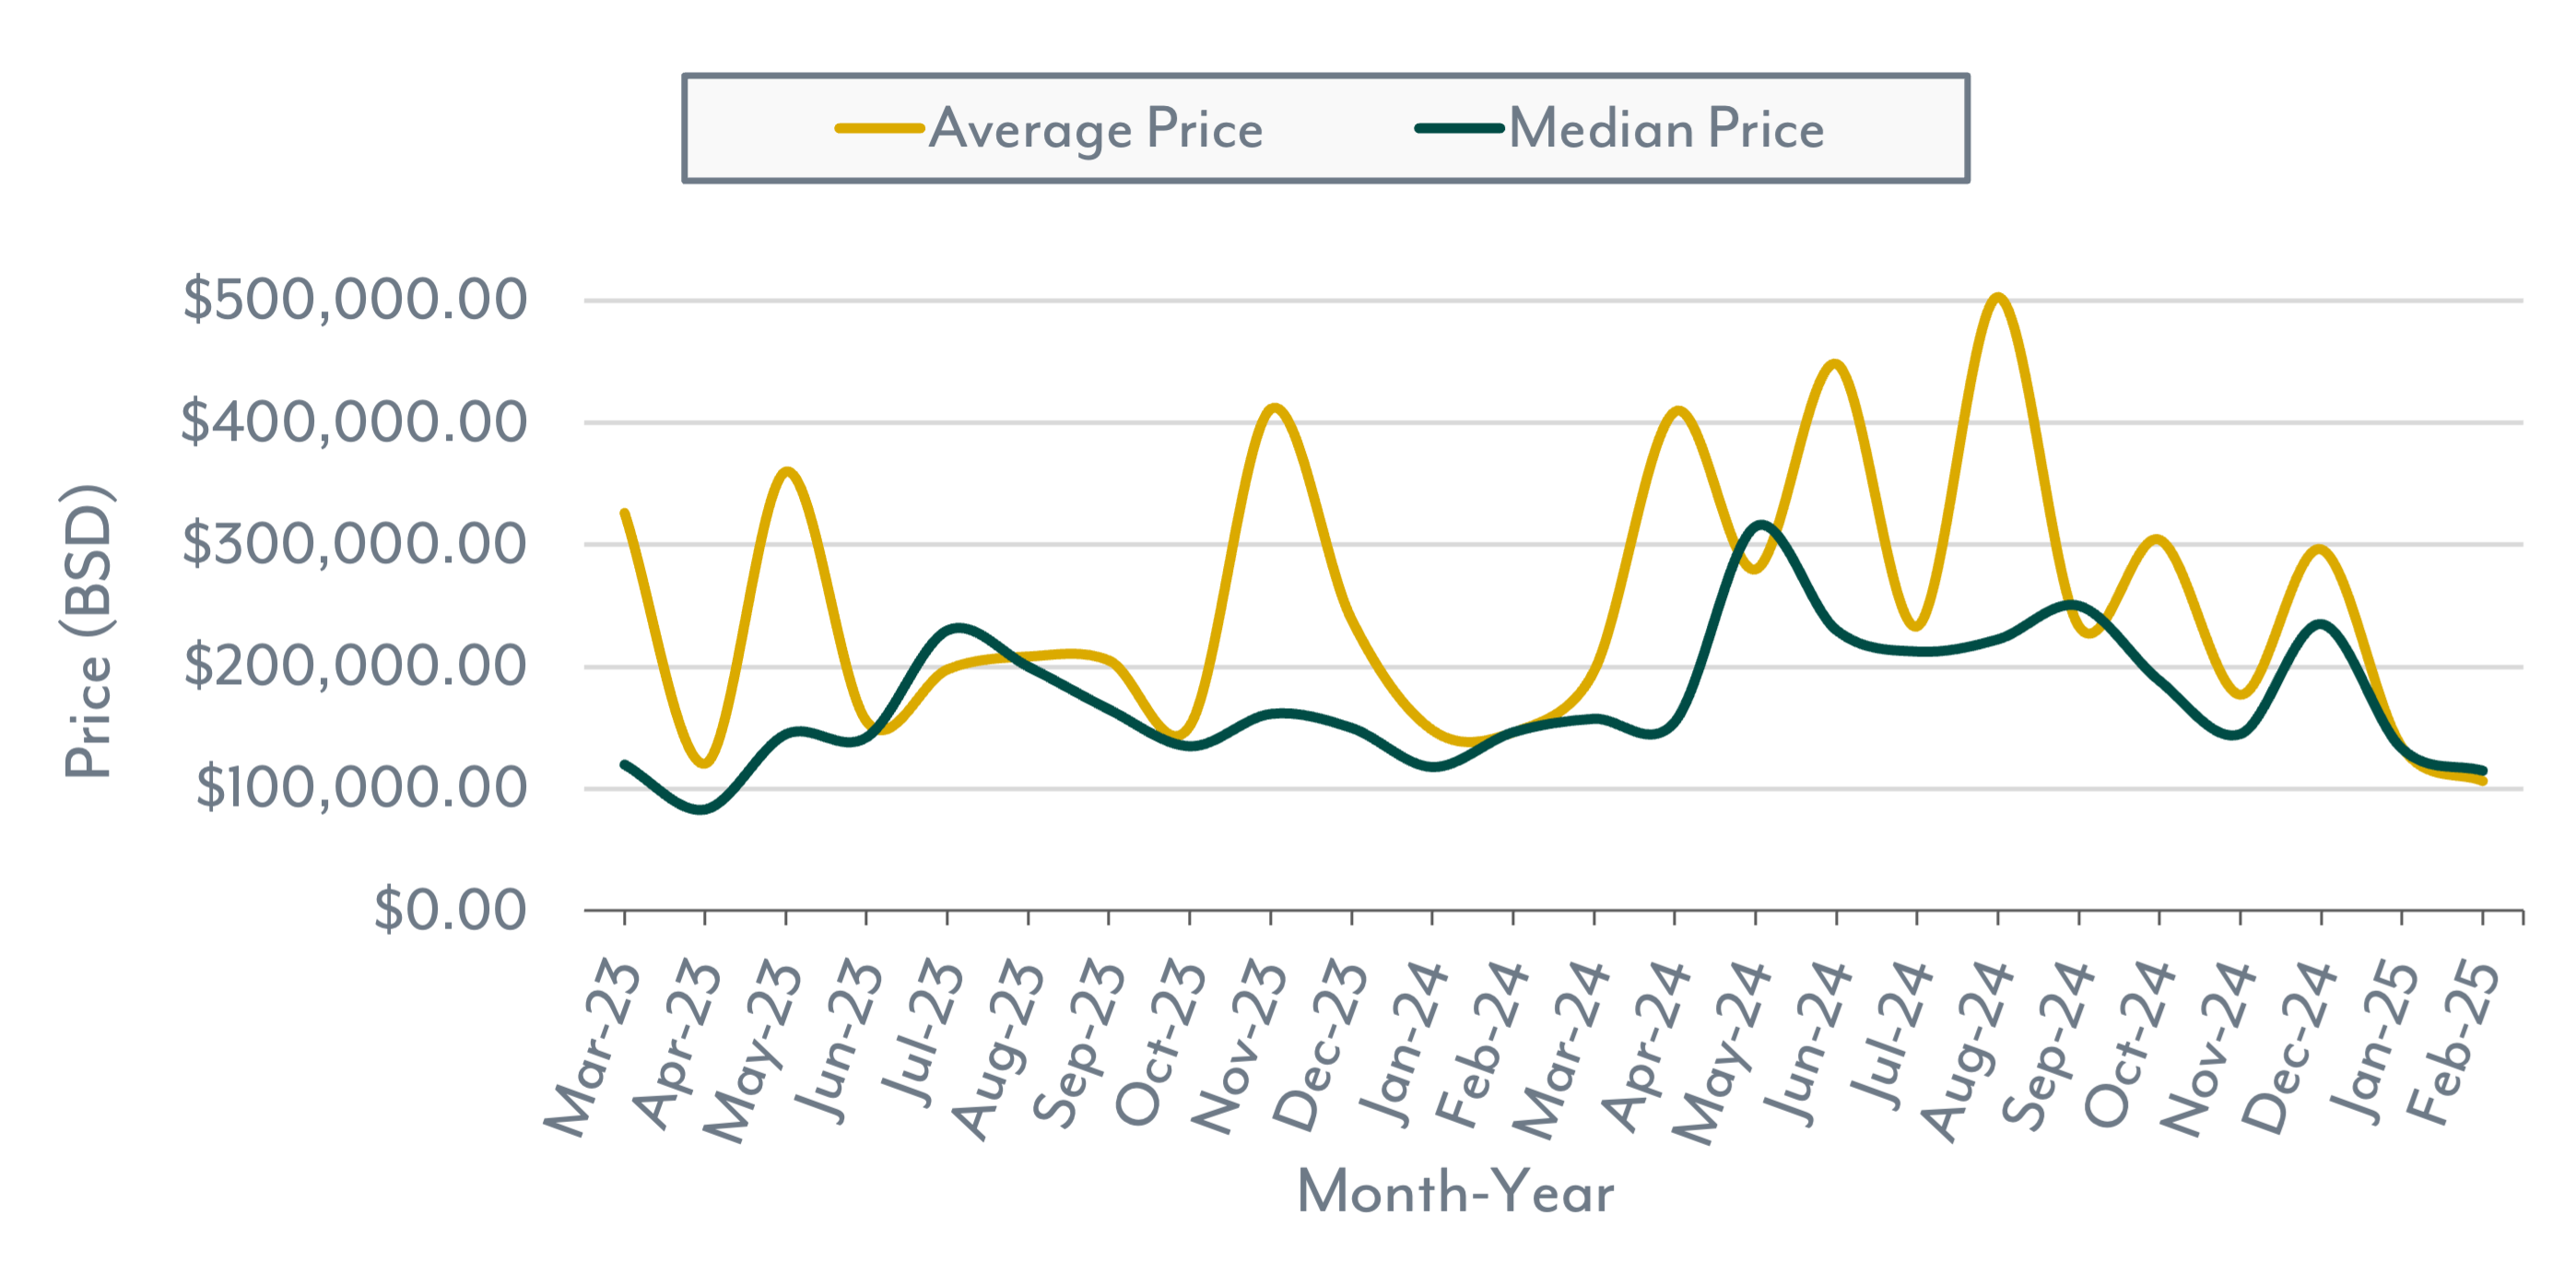
Home prices experienced notable gains. The Median Sales Price surged 54.1% YoY to $662,500, while the Average Sales Price increased 8.2% to $1,302,000. These price jumps were likely driven by luxury home sales. On a YTD basis, the median price rose 19.0%, and the average price climbed 45.0%, reinforcing upward pricing momentum.
Sellers maintained a strong position, with the Average List-to-Sale Price Ratio rising 3.2% YoY to 98.1%, meaning properties sold closer to their asking price. However, a slight YTD decline of 0.7% suggests some negotiation variability.
Overall, February 2025 reflects a competitive market with tightening supply, strong demand, and rising home values. Moving forward, supply constraints and affordability concerns will be key factors in shaping future sales activity and pricing trends.
Home Market Indicators
New Listings, Contracted Sales & Completed Sales
Average & Median Price

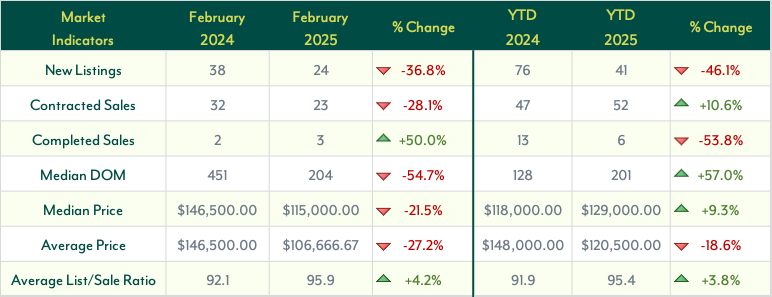
The Nassau and Paradise Island land market in February 2025 reflected ongoing shifts in inventory, sales activity, and pricing.
New Listings fell 36.8% year-over-year (YoY) to 24 properties, reinforcing a tightening supply. Year-to-date (YTD), listings dropped 46.1%, suggesting fewer landowners are bringing properties to market, potentially due to seller hesitation or reduced development activity.
Buyer demand remained steady despite lower inventory. Contracted Sales declined 28.1% YoY to 23 transactions, but YTD figures showed a 10.6% increase, indicating long-term resilience. Completed Sales rose 50.0% YoY from 2 to 3 transactions, yet YTD, fell 53.8%, reflecting variability in final deal closures.
Market timing showed contrasting trends. The Median Days on Market (DOM) dropped 54.7% YoY to 204 days, suggesting quicker sales. However, YTD, DOM increased 57.0%, signaling that while some properties are moving faster, others remain on the market longer due to price negotiations or financing delays.
Pricing trends were mixed. The Median Sales Price declined 21.5% YoY to $115,000, while the Average Sales Price dropped 27.2% to $106,667. However, YTD figures painted a different picture—the median price rose 9.3% to $129,000, while the average price fell 18.6% to $120,500, suggesting strength in mid-range transactions but a cooling at the higher end.
Sellers maintained solid positioning, with the Average List-to-Sale Price Ratio increasing 4.2% YoY to 95.9%, meaning properties sold closer to their asking prices.
Overall, February 2025 highlighted a land market with tightening inventory, stable demand, and fluctuating price trends. Faster sales suggest increased buyer urgency, but shifting pricing dynamics and lower transaction volumes indicate a period of adjustment as the market finds its balance.
Land Market Indicators
New Listings, Contracted Sales & Completed Sales
Average & Median Price
Not sure if you are ready to buy or sell?
We're able to explain what these numbers mean for you and better guide you to make an informed decision that is best for you based on the current market conditions.