Nassau & Paradise Island Market Report - January 2025

Morley
We're Morley, a real estate company owned and operated by Bahamians with experience spanning four generations...
We're Morley, a real estate company owned and operated by Bahamians with experience spanning four generations...
Our monthly Market Report provides meaningful and valuable information, to empower buyers and sellers who are considering a real estate transaction in Nassau or Paradise Island (Bahamas).
If you're considering selling your property or buying property on Nassau or Paradise Island, it's essential to understand what's happening in The Bahamas' real estate market. Knowing the most important data, such as median and average prices, the number of properties sold, the number of new listings, and the days on the market will better prepare you for selling or buying.
We are happy to share our January 2025 analysis of the Nassau and Paradise Island market. We also encourage you to review our quarterly market reports on Abaco, Eleuthera, Exuma, Grand Bahama and New Providence.
Our market reports provide Morley's interpretation of the data from the Bahamas Real Estate Association MLS. Even though the MLS does not include all real estate sales and related real estate data, we believe the MLS data is reasonable and consistent to be reliable to use to estimate local real estate trends.

The Nassau and Paradise Island housing market in January 2025 continues to show strong buyer activity and shifting market dynamics compared to last year.
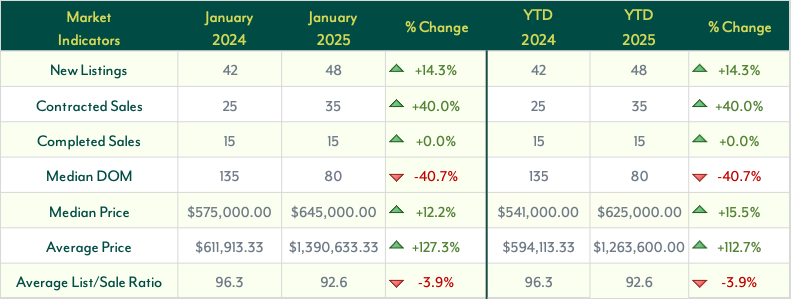
New Listings increased by 14.3% year-over-year (YoY), rising to 48 properties. This uptick suggests growing seller confidence and a steady flow of inventory entering the market. While this increase signals a positive trend, it remains to be seen whether this momentum will continue in the coming months. Contracted Sales surged by 40.0% YoY to 35, indicating sustained buyer demand and heightened competition among purchasers. Meanwhile, Completed Sales remained unchanged at 15, suggesting a stable pace of finalized transactions despite fluctuations in other metrics.
The Median Days on Market (DOM) saw a sharp 40.7% decline YoY, dropping to 80 days. This suggests that properties are selling much faster than they were a year ago, likely due to heightened demand and a competitive market. Buyers appear to be acting quickly when they find desirable properties, which could lead to increased pressure on inventory levels if this trend continues.
On the pricing front, the Median Sales Price increased by 12.2% YoY, reaching $645,000.00, while the Average Sales Price skyrocketed by 127.3% to $1,390,633.33. This substantial increase in average pricing suggests that high-end properties played a significant role in market activity. Luxury home sales may be driving this surge, reflecting a growing interest in premium real estate within Nassau and Paradise Island.
Finally, the Average List-to-Sale Price Ratio declined by 3.9% YoY to 92.6%, indicating that buyers may have gained slightly more negotiating power compared to last year. Sellers might need to adjust their pricing strategies or expectations as buyers become more selective in a fluctuating market.
Overall, January 2025 homes data points to an active market with rising prices, faster sales, and strong demand, reinforcing positive momentum. As the year progresses, it will be important to monitor whether inventory can keep pace with buyer demand and how pricing trends continue to evolve.
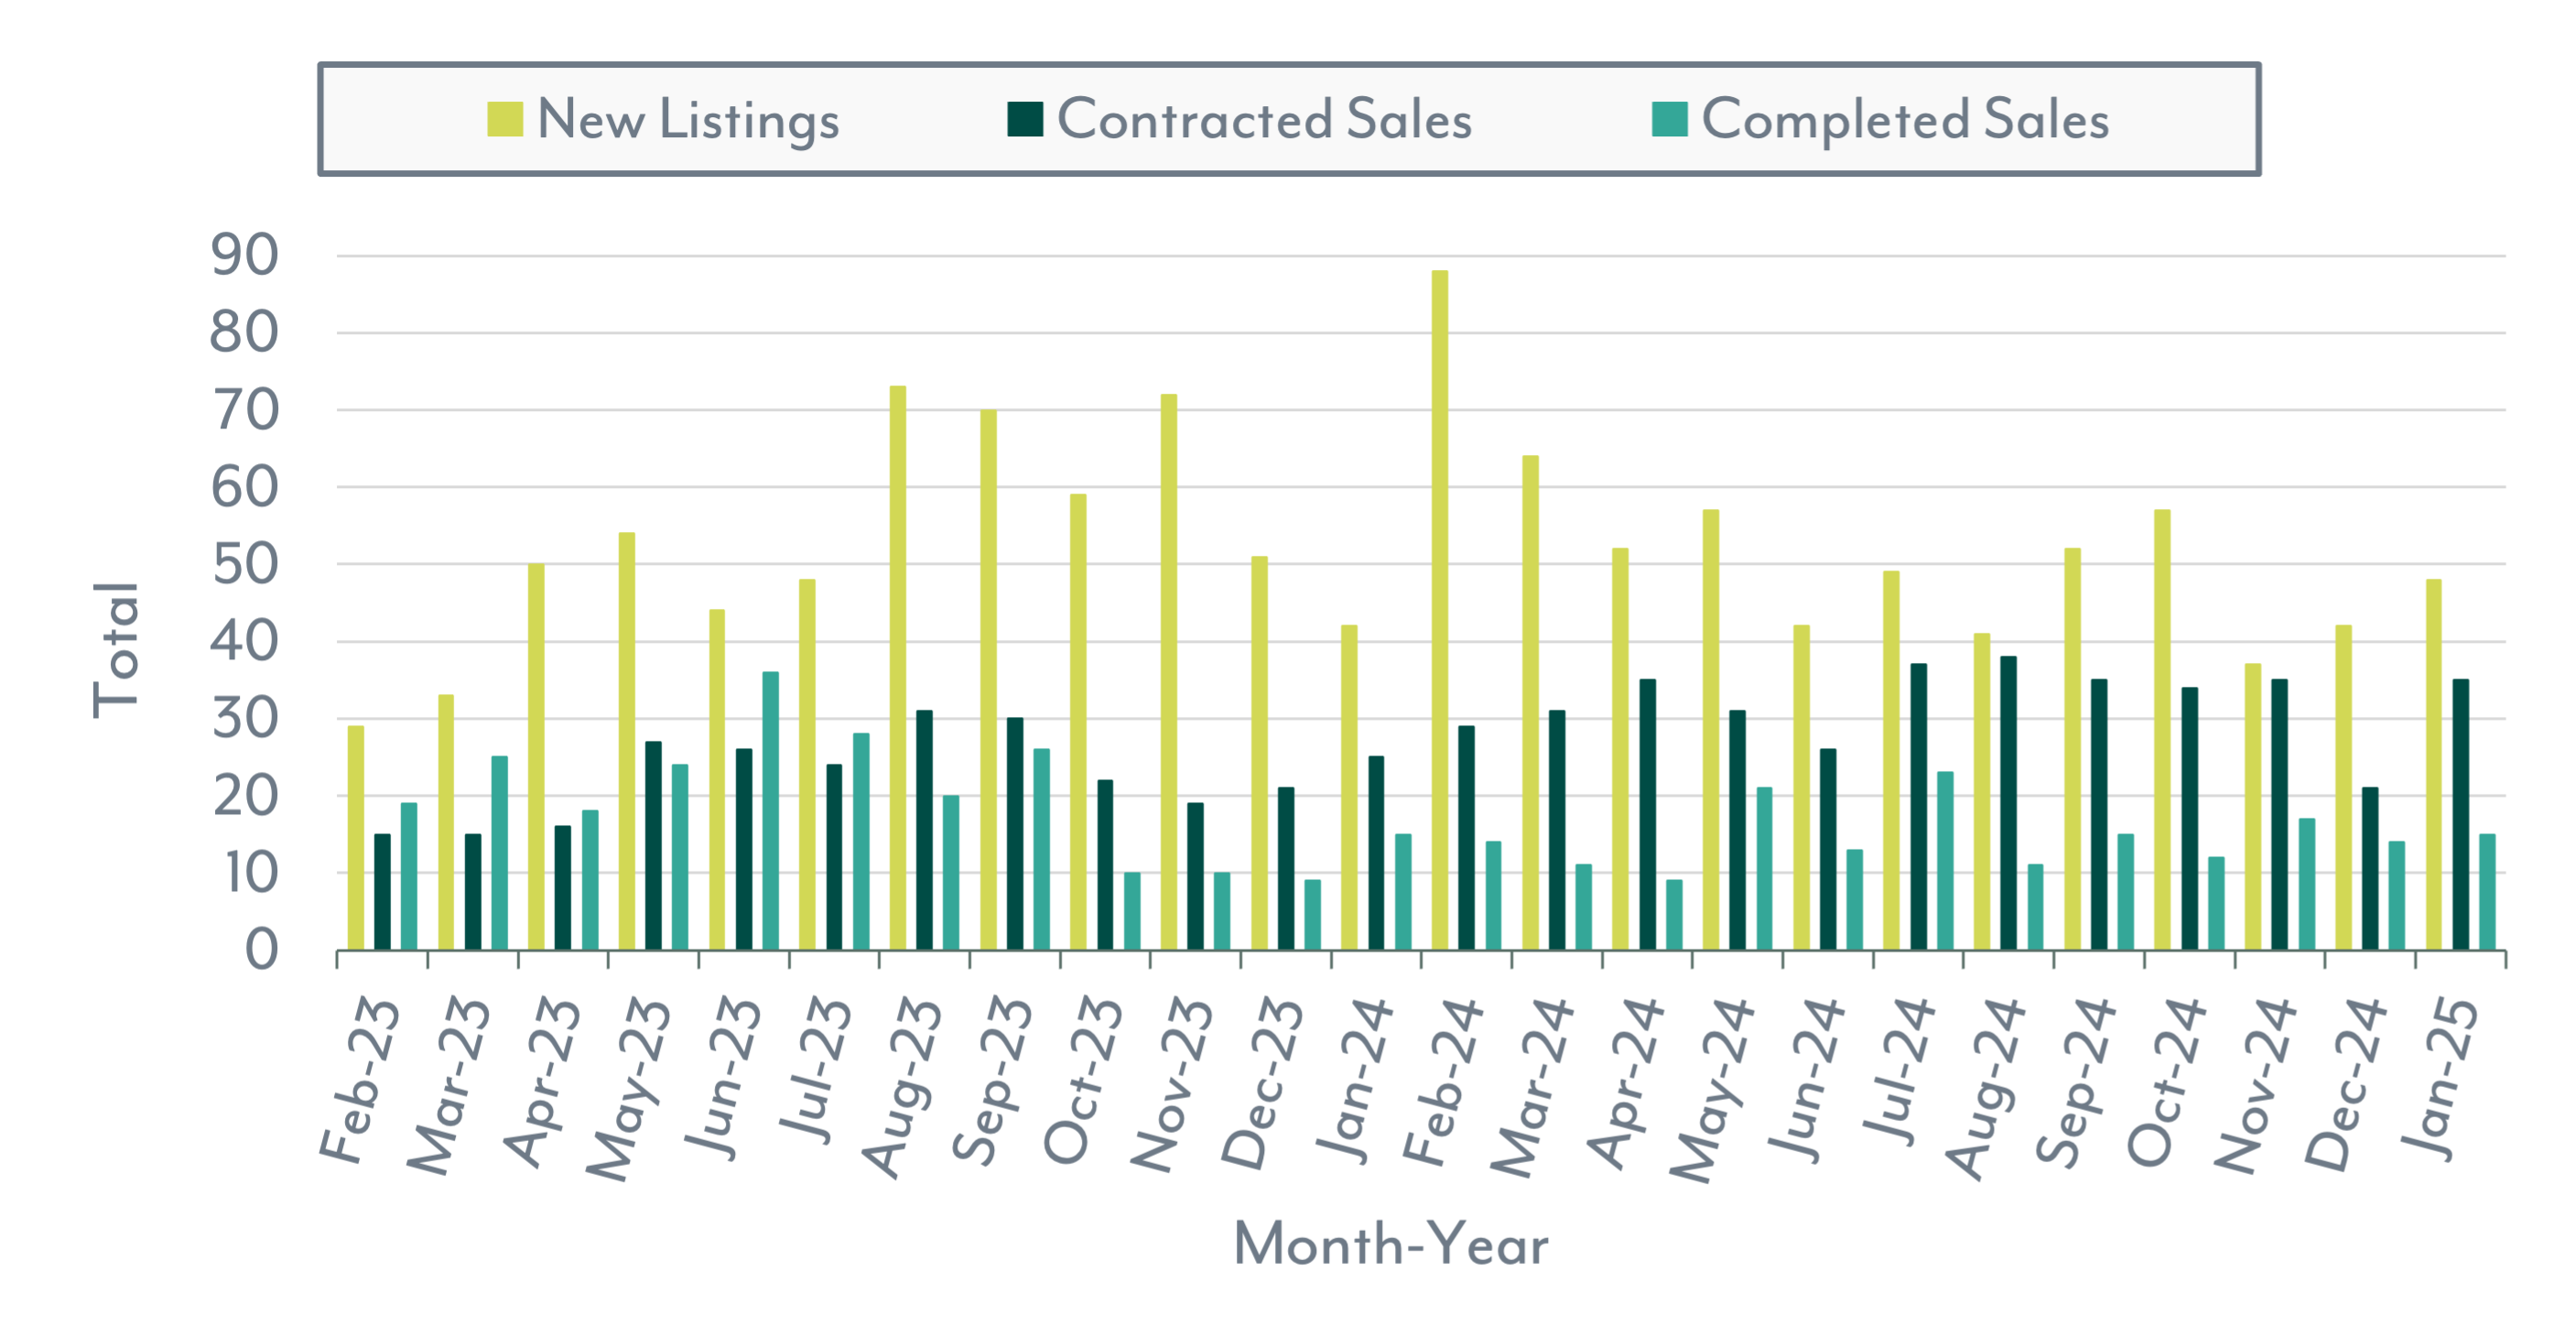
Home Market Indicators
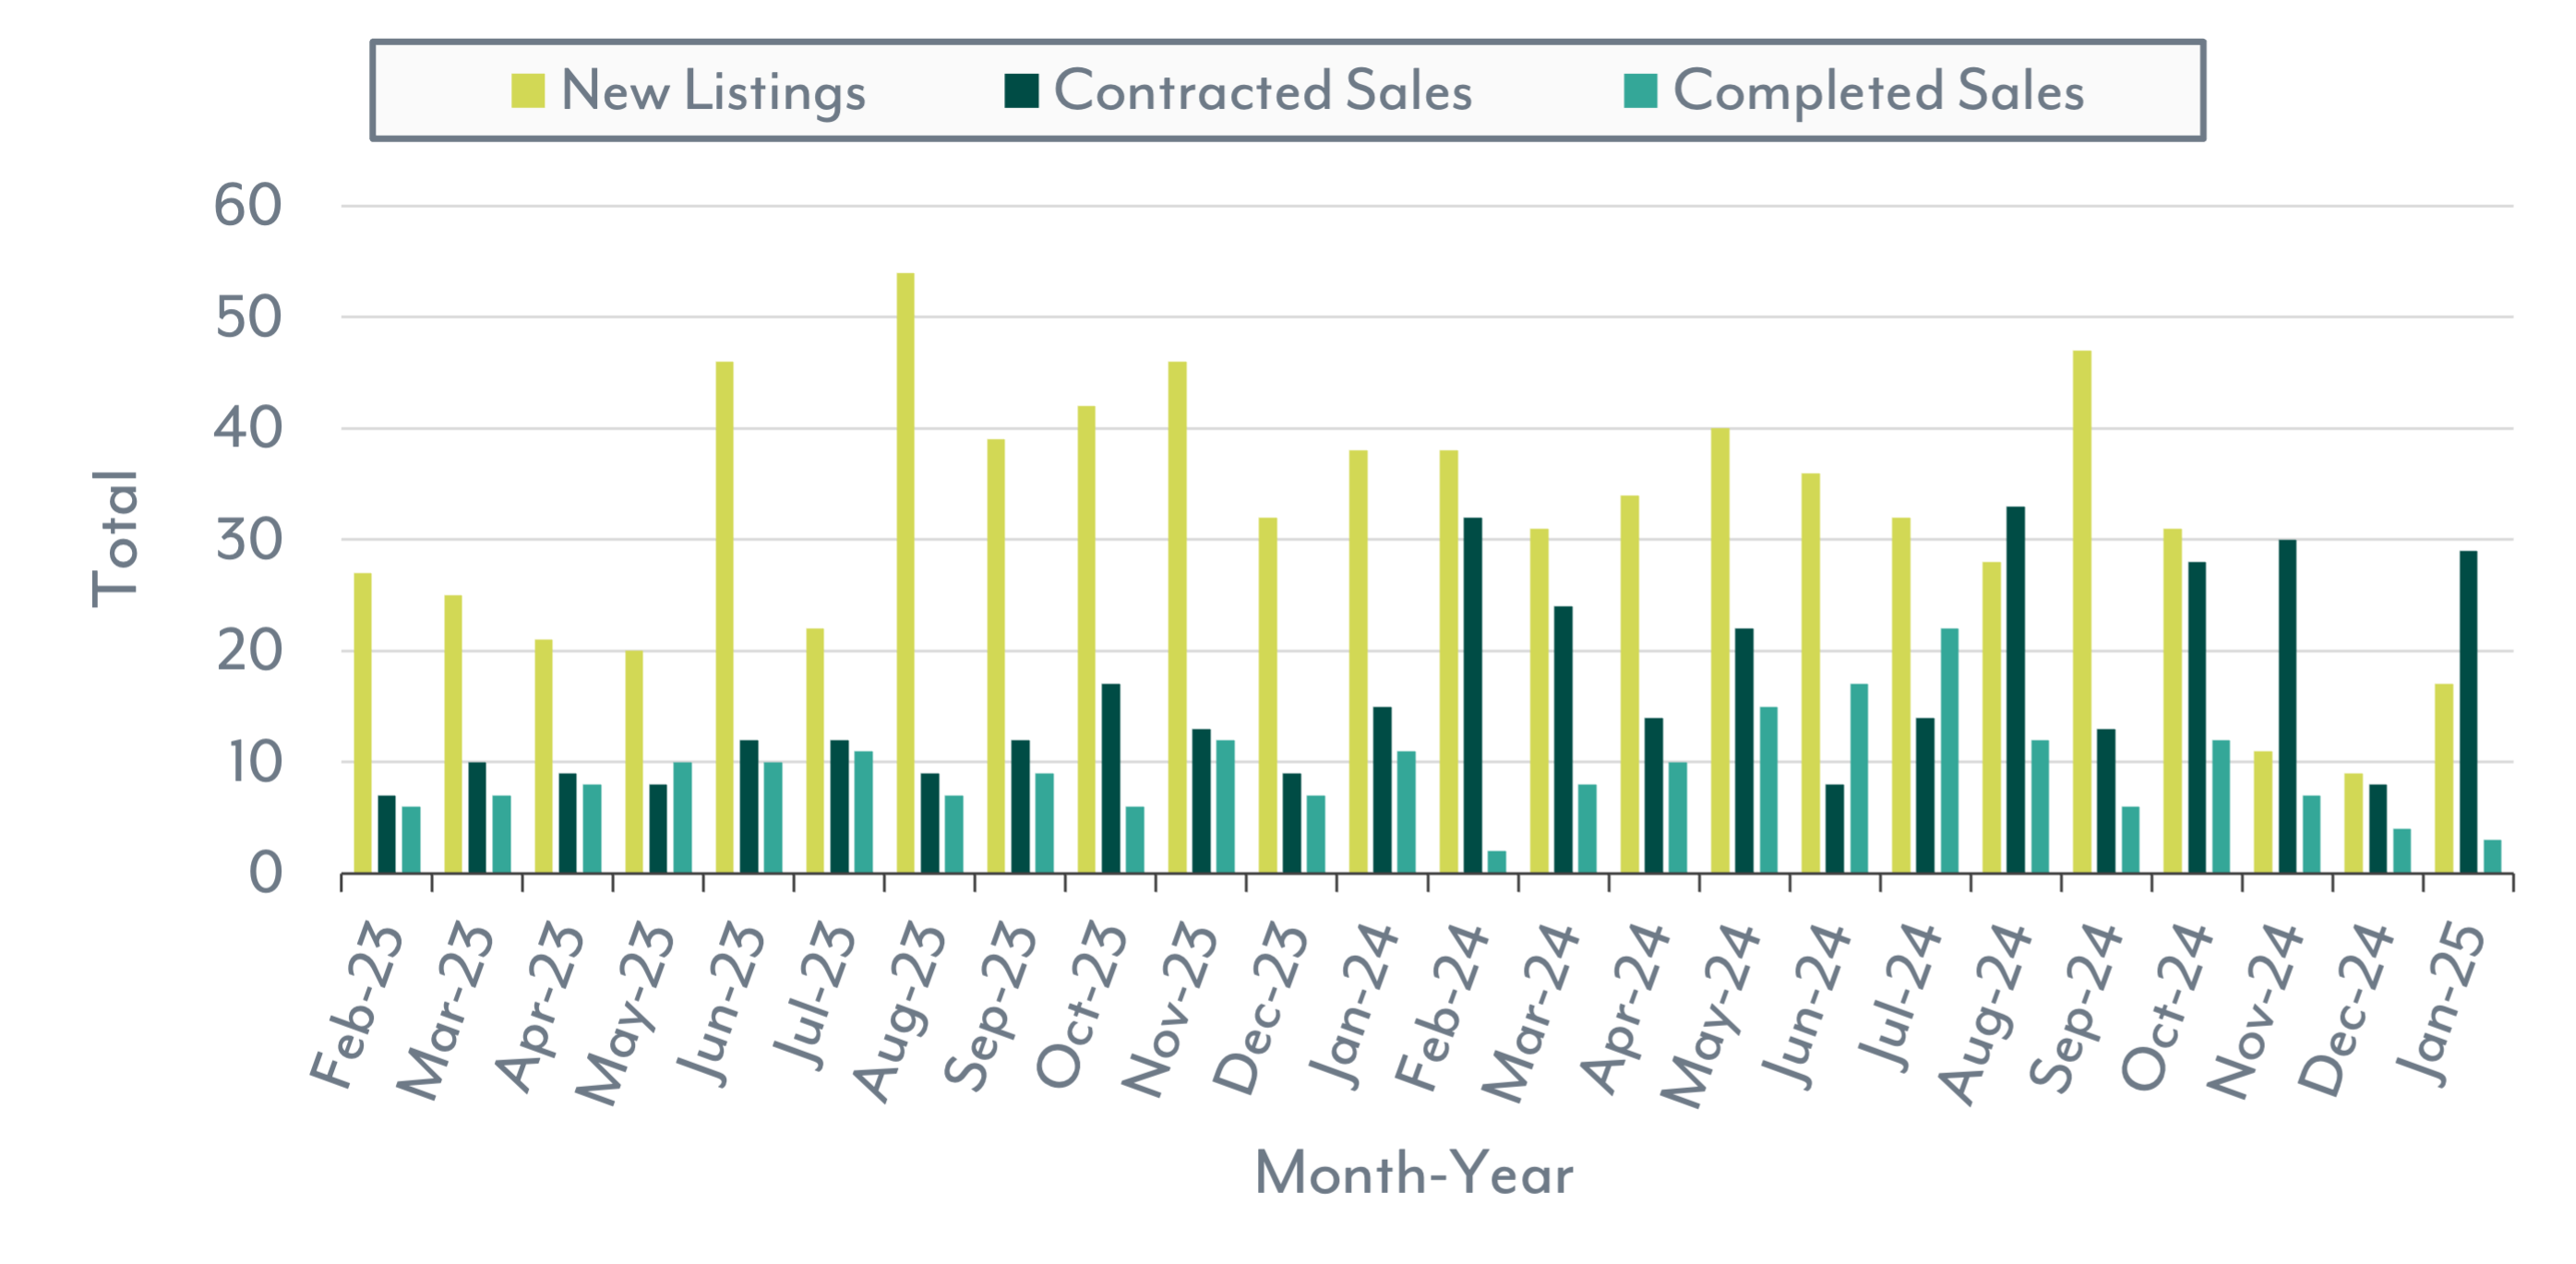
New Listings, Contracted Sales & Completed Sales
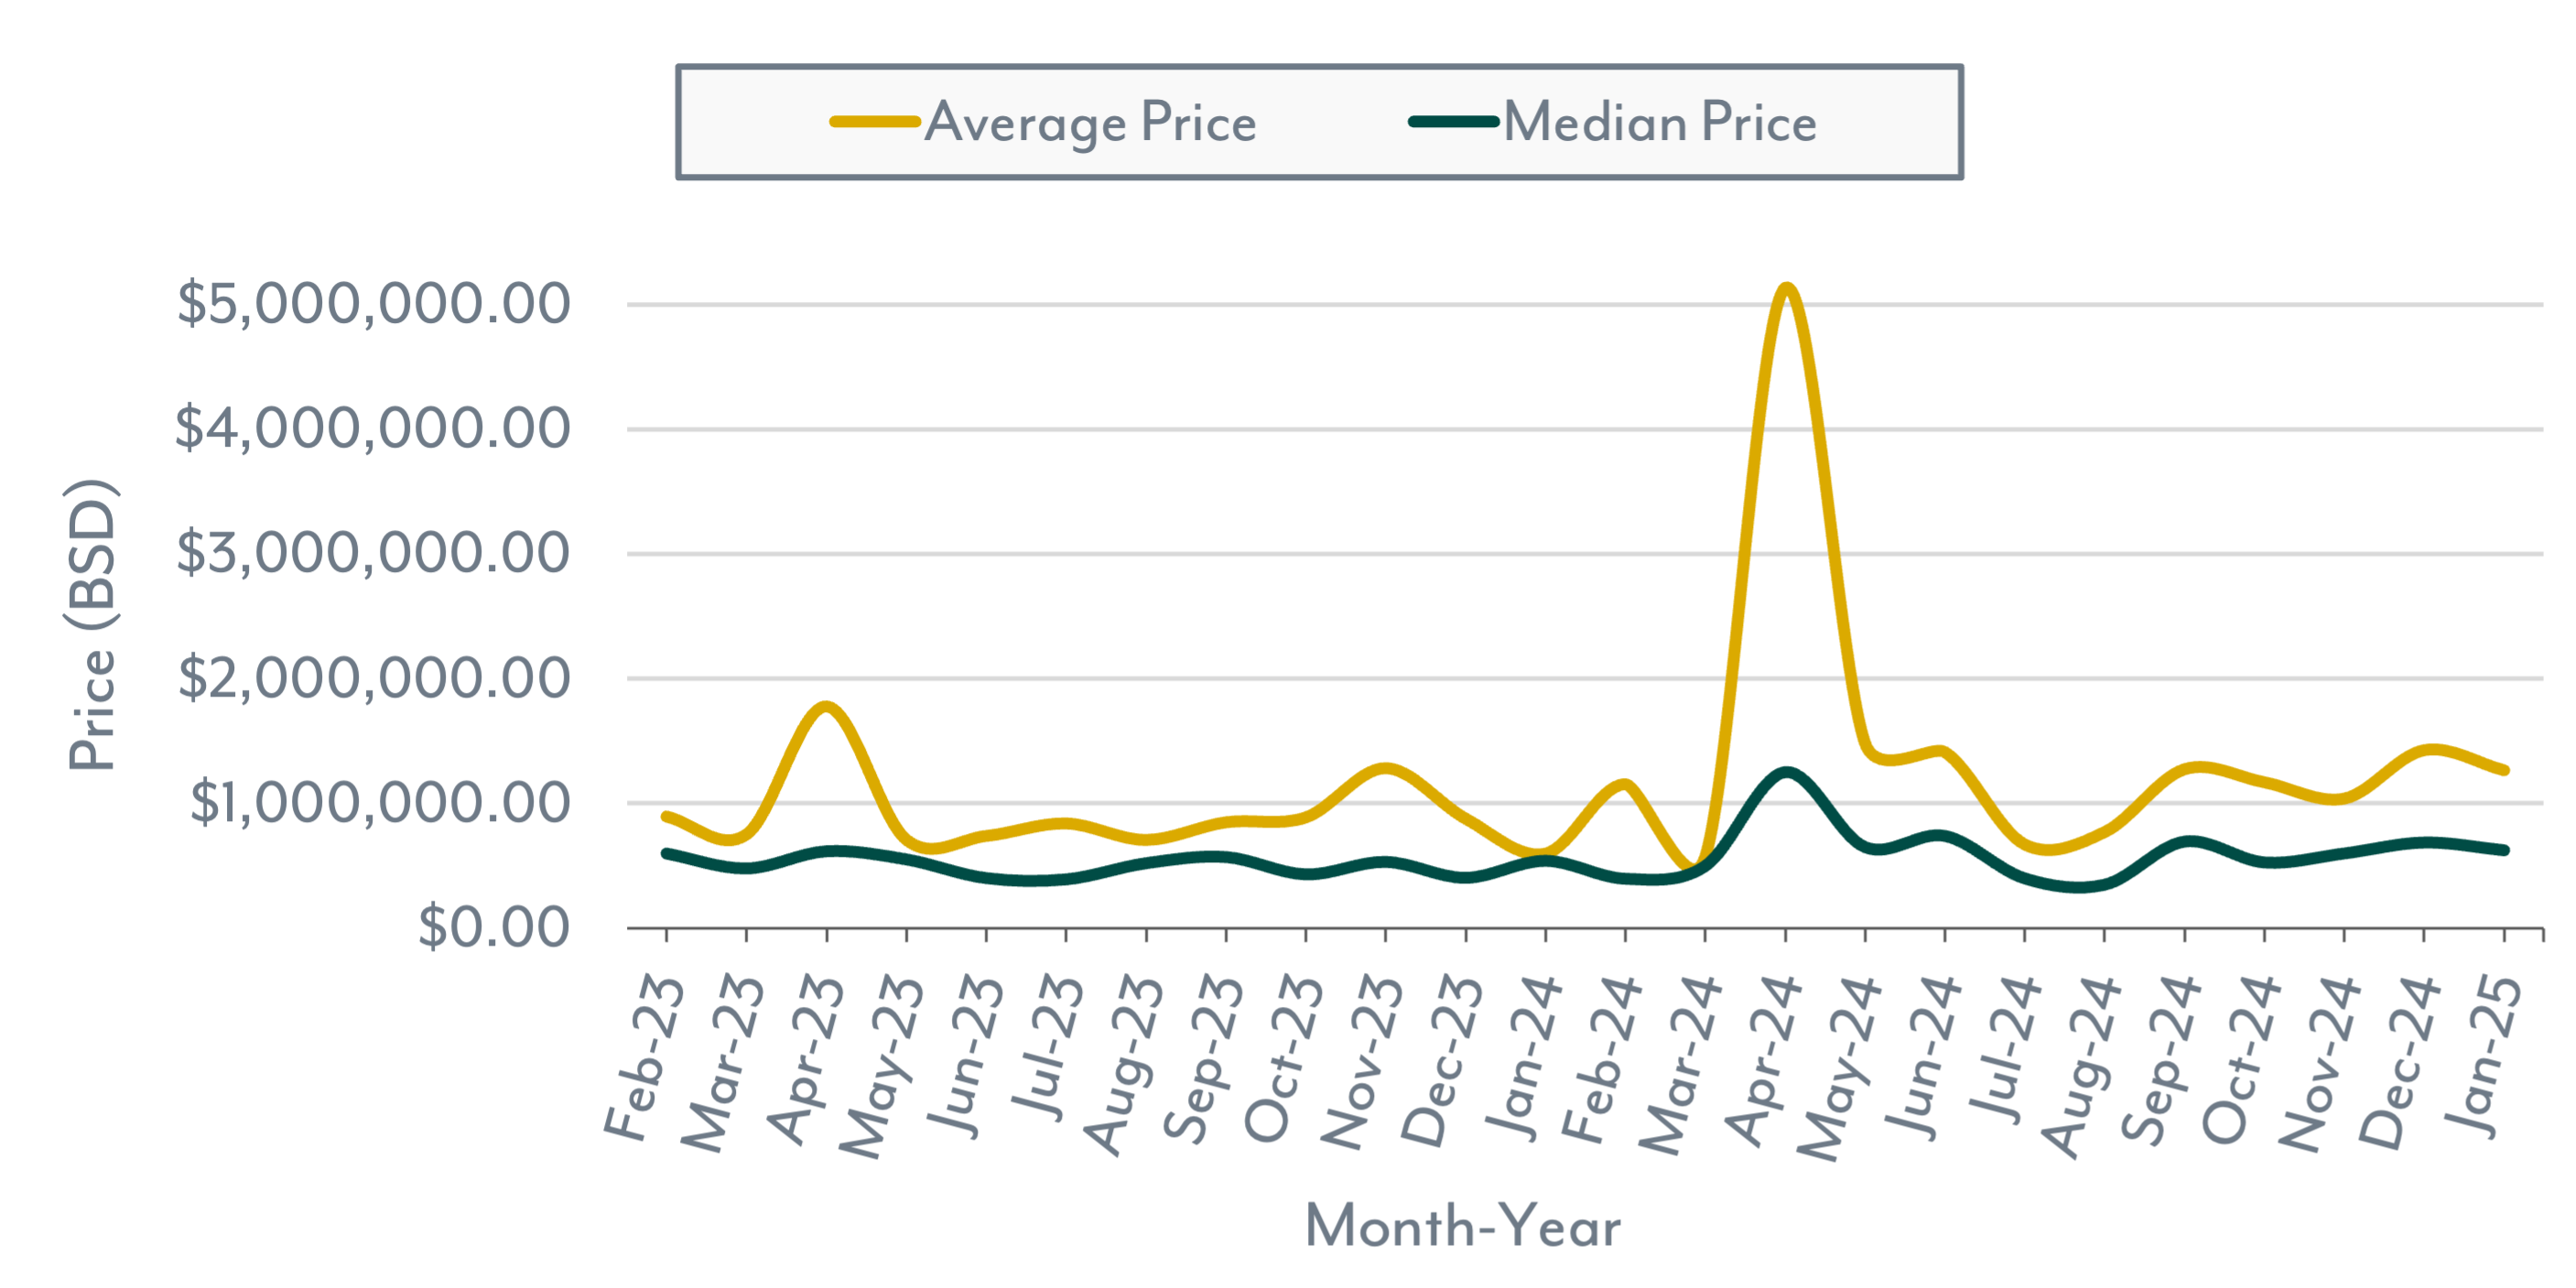
Average & Median Price

The Nassau and Paradise Island land market in January 2025 saw notable shifts in inventory, sales activity, and pricing compared to last year.
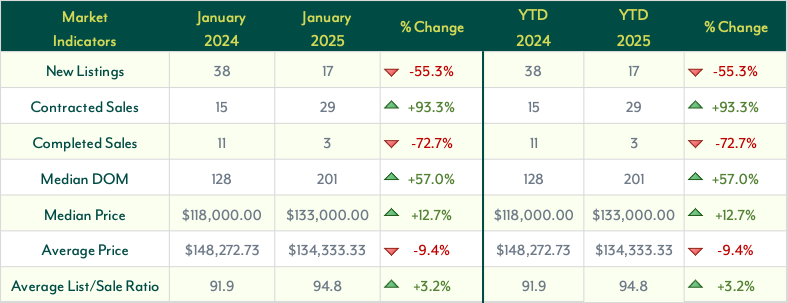
New Listings plummeted 55.3% year-over-year (YoY) to just 17 properties, signaling a decrease in available land inventory. This drop may indicate seller hesitation, a tightening market, or limited new development opportunities. Contracted Sales, on the other hand, nearly doubled, surging 93.3% YoY to 29, reflecting strong buyer demand despite fewer new listings. This surge suggests that buyers are still actively seeking land opportunities.
Completed Sales declined sharply, down 72.7% YoY to just 3 transactions. This slowdown contrasts with the rise in contracted sales, suggesting pending deals that have yet to be finalized or delays in closing processes.
Median Days on Market (DOM) increased 57.0% YoY to 201 days, indicating that properties are taking longer to close, possibly due to shifting buyer dynamics, pricing negotiations, or more complex financing arrangements.
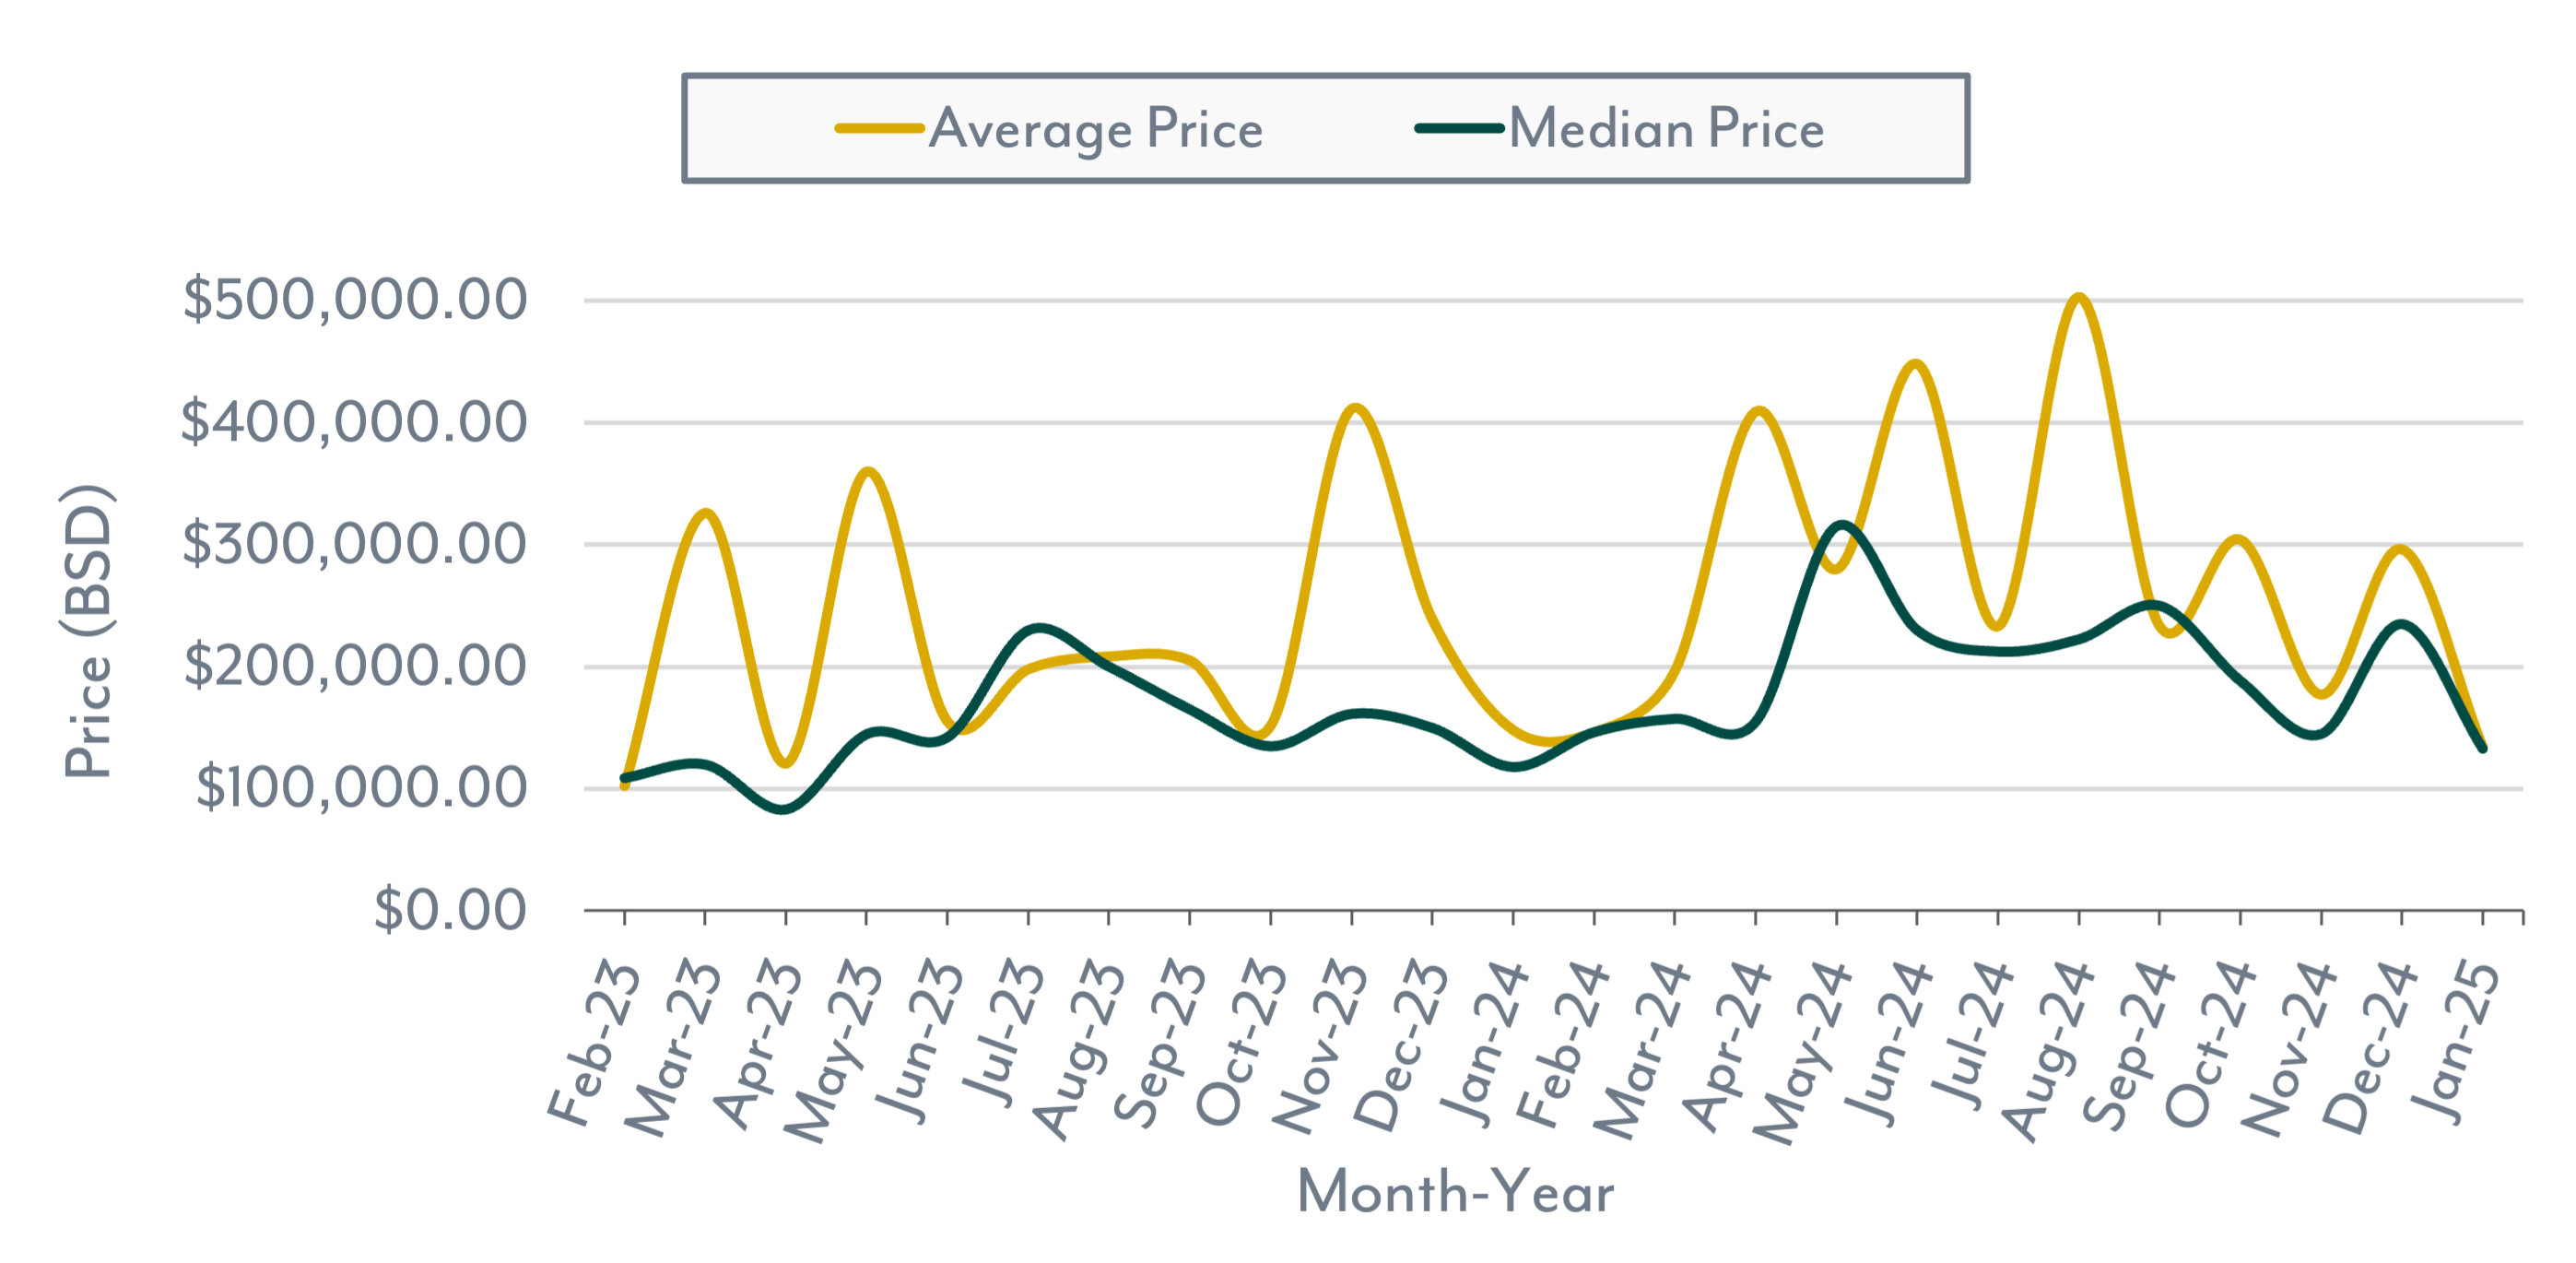
Price trends remained mixed. The Median Sales Price climbed 12.7% YoY to $133,000.00, continuing an upward trend. However, the Average Sales Price dipped 9.4% YoY to $134,333.33, likely influenced by more sales in lower price brackets or adjustments in buyer preferences. While overall land values remain strong, individual transaction dynamics show variability.
The Average List-to-Sale Price Ratio improved by 3.2% YoY, reaching 94.8%, suggesting that sellers are achieving prices closer to their expectations, reinforcing overall market stability.
Overall, January 2025 presented a land market characterized by fewer listings, strong buyer activity, and fluctuating sale prices. While contracted sales surged, the slowdown in completed transactions and extended DOM suggest a market in transition as buyers and sellers navigate evolving conditions.
Land Market Indicators
New Listings, Contracted Sales & Completed Sales
Average & Median Price
Not sure if you are ready to buy or sell?
We're able to explain what these numbers mean for you and better guide you to make an informed decision that is best for you based on the current market conditions.