Nassau & Paradise Island Market Report - June 2024

Morley
We're Morley, a real estate company owned and operated by Bahamians with experience spanning four generations...
We're Morley, a real estate company owned and operated by Bahamians with experience spanning four generations...
Our monthly Market Report provides meaningful and valuable information, to empower buyers and sellers who are considering a real estate transaction in Nassau or Paradise Island (Bahamas).
If you're considering selling your property or buying property on Nassau or Paradise Island, it's essential to understand what's happening in The Bahamas' real estate market. Knowing the most important data, such as median and average prices, the number of properties sold, the number of new listings, and the days on the market will better prepare you for selling or buying.
We are happy to share our June 2024 analysis of the Nassau and Paradise Island market. We also encourage you to review our quarterly market reports on Abaco, Eleuthera, Exuma, Grand Bahama and New Providence.
Our market reports provide Morley's interpretation of the data from the Bahamas Real Estate Association MLS. Even though the MLS does not include all real estate sales and related real estate data, we believe the MLS data is reasonable and consistent to be reliable to use to estimate local real estate trends.

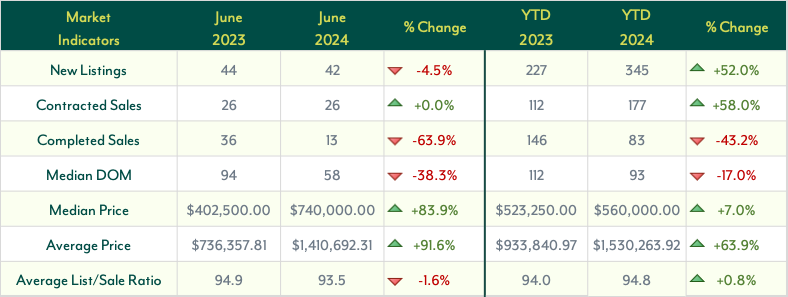
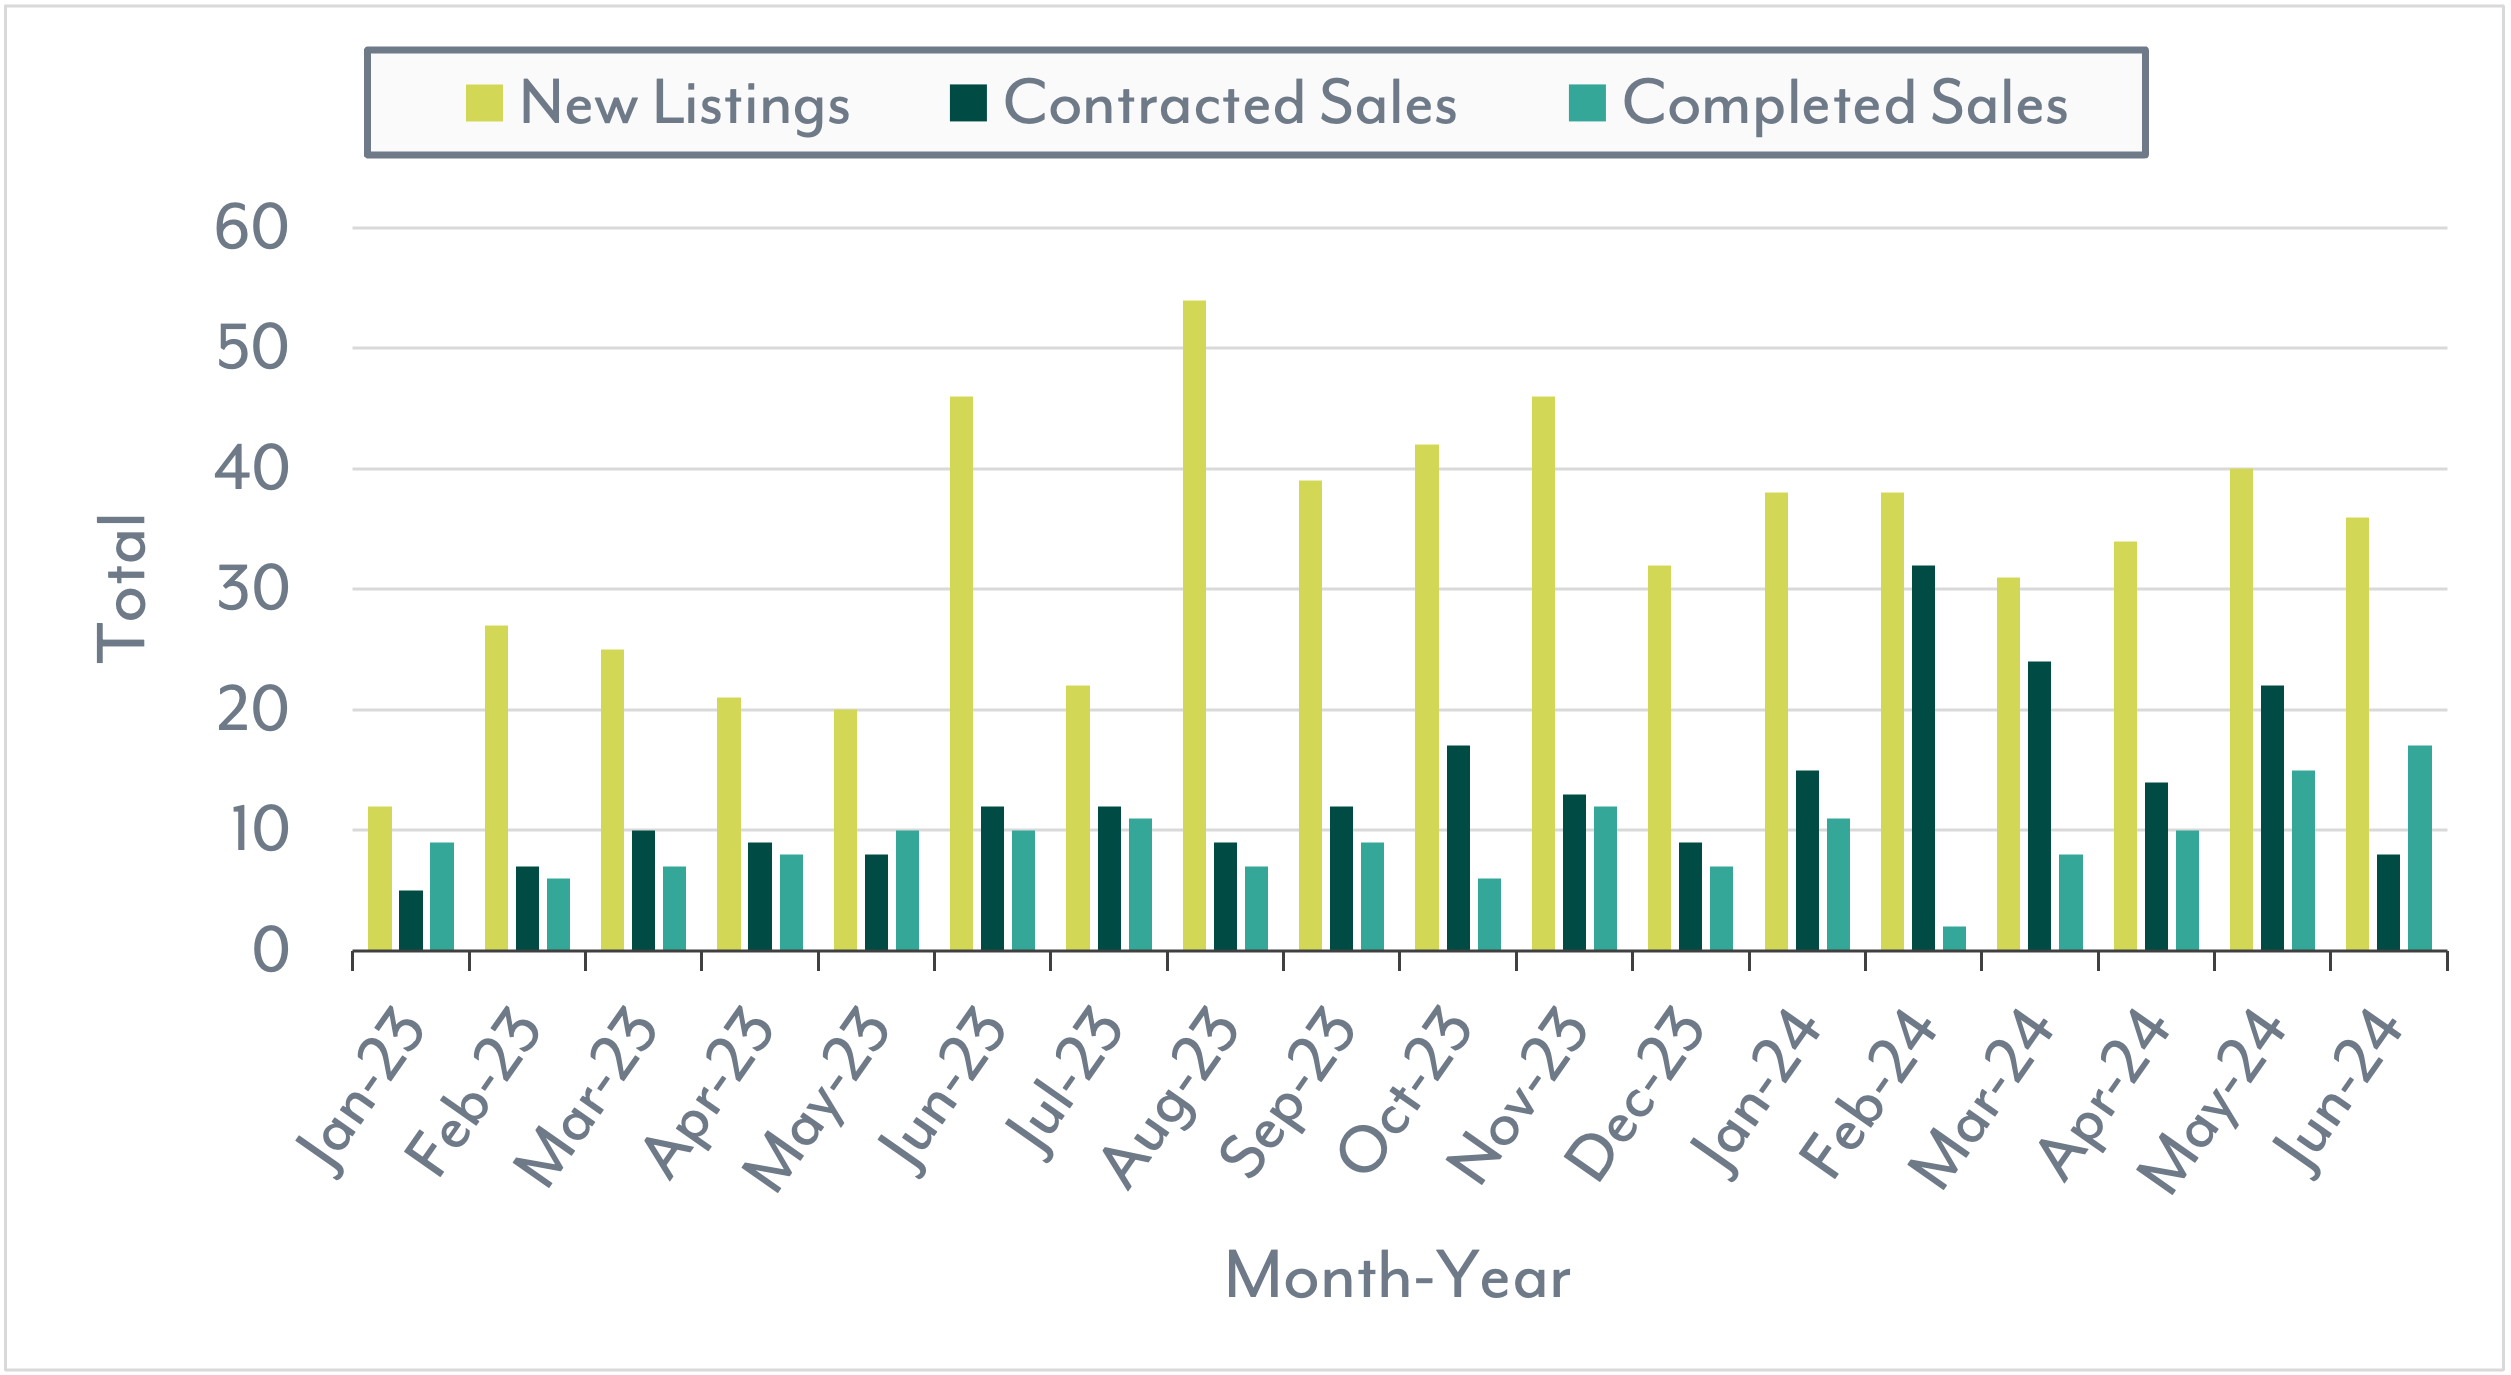
The Nassau and Paradise Island housing market continues to experience similar trends to what this market has seen over the past five months. The volume of New Listings has decreased by 4.5% compared to June 2023 but is up 52.0% year-to-date (YTD).
Despite this decline in New Listings, Contracted Sales have remained steady, with no change year-over-year (YoY) but a 58.0% increase YTD, indicating higher demand in 2024 compared to 2023.
While Contracted Sales are up, Completed Sales have decreased significantly. YoY, Completed Sales fell by 63.9% in June 2024, and YTD, there has been a 43.2% decrease. However, this is still above the lowest volume in the past two years, seen in April 2024.
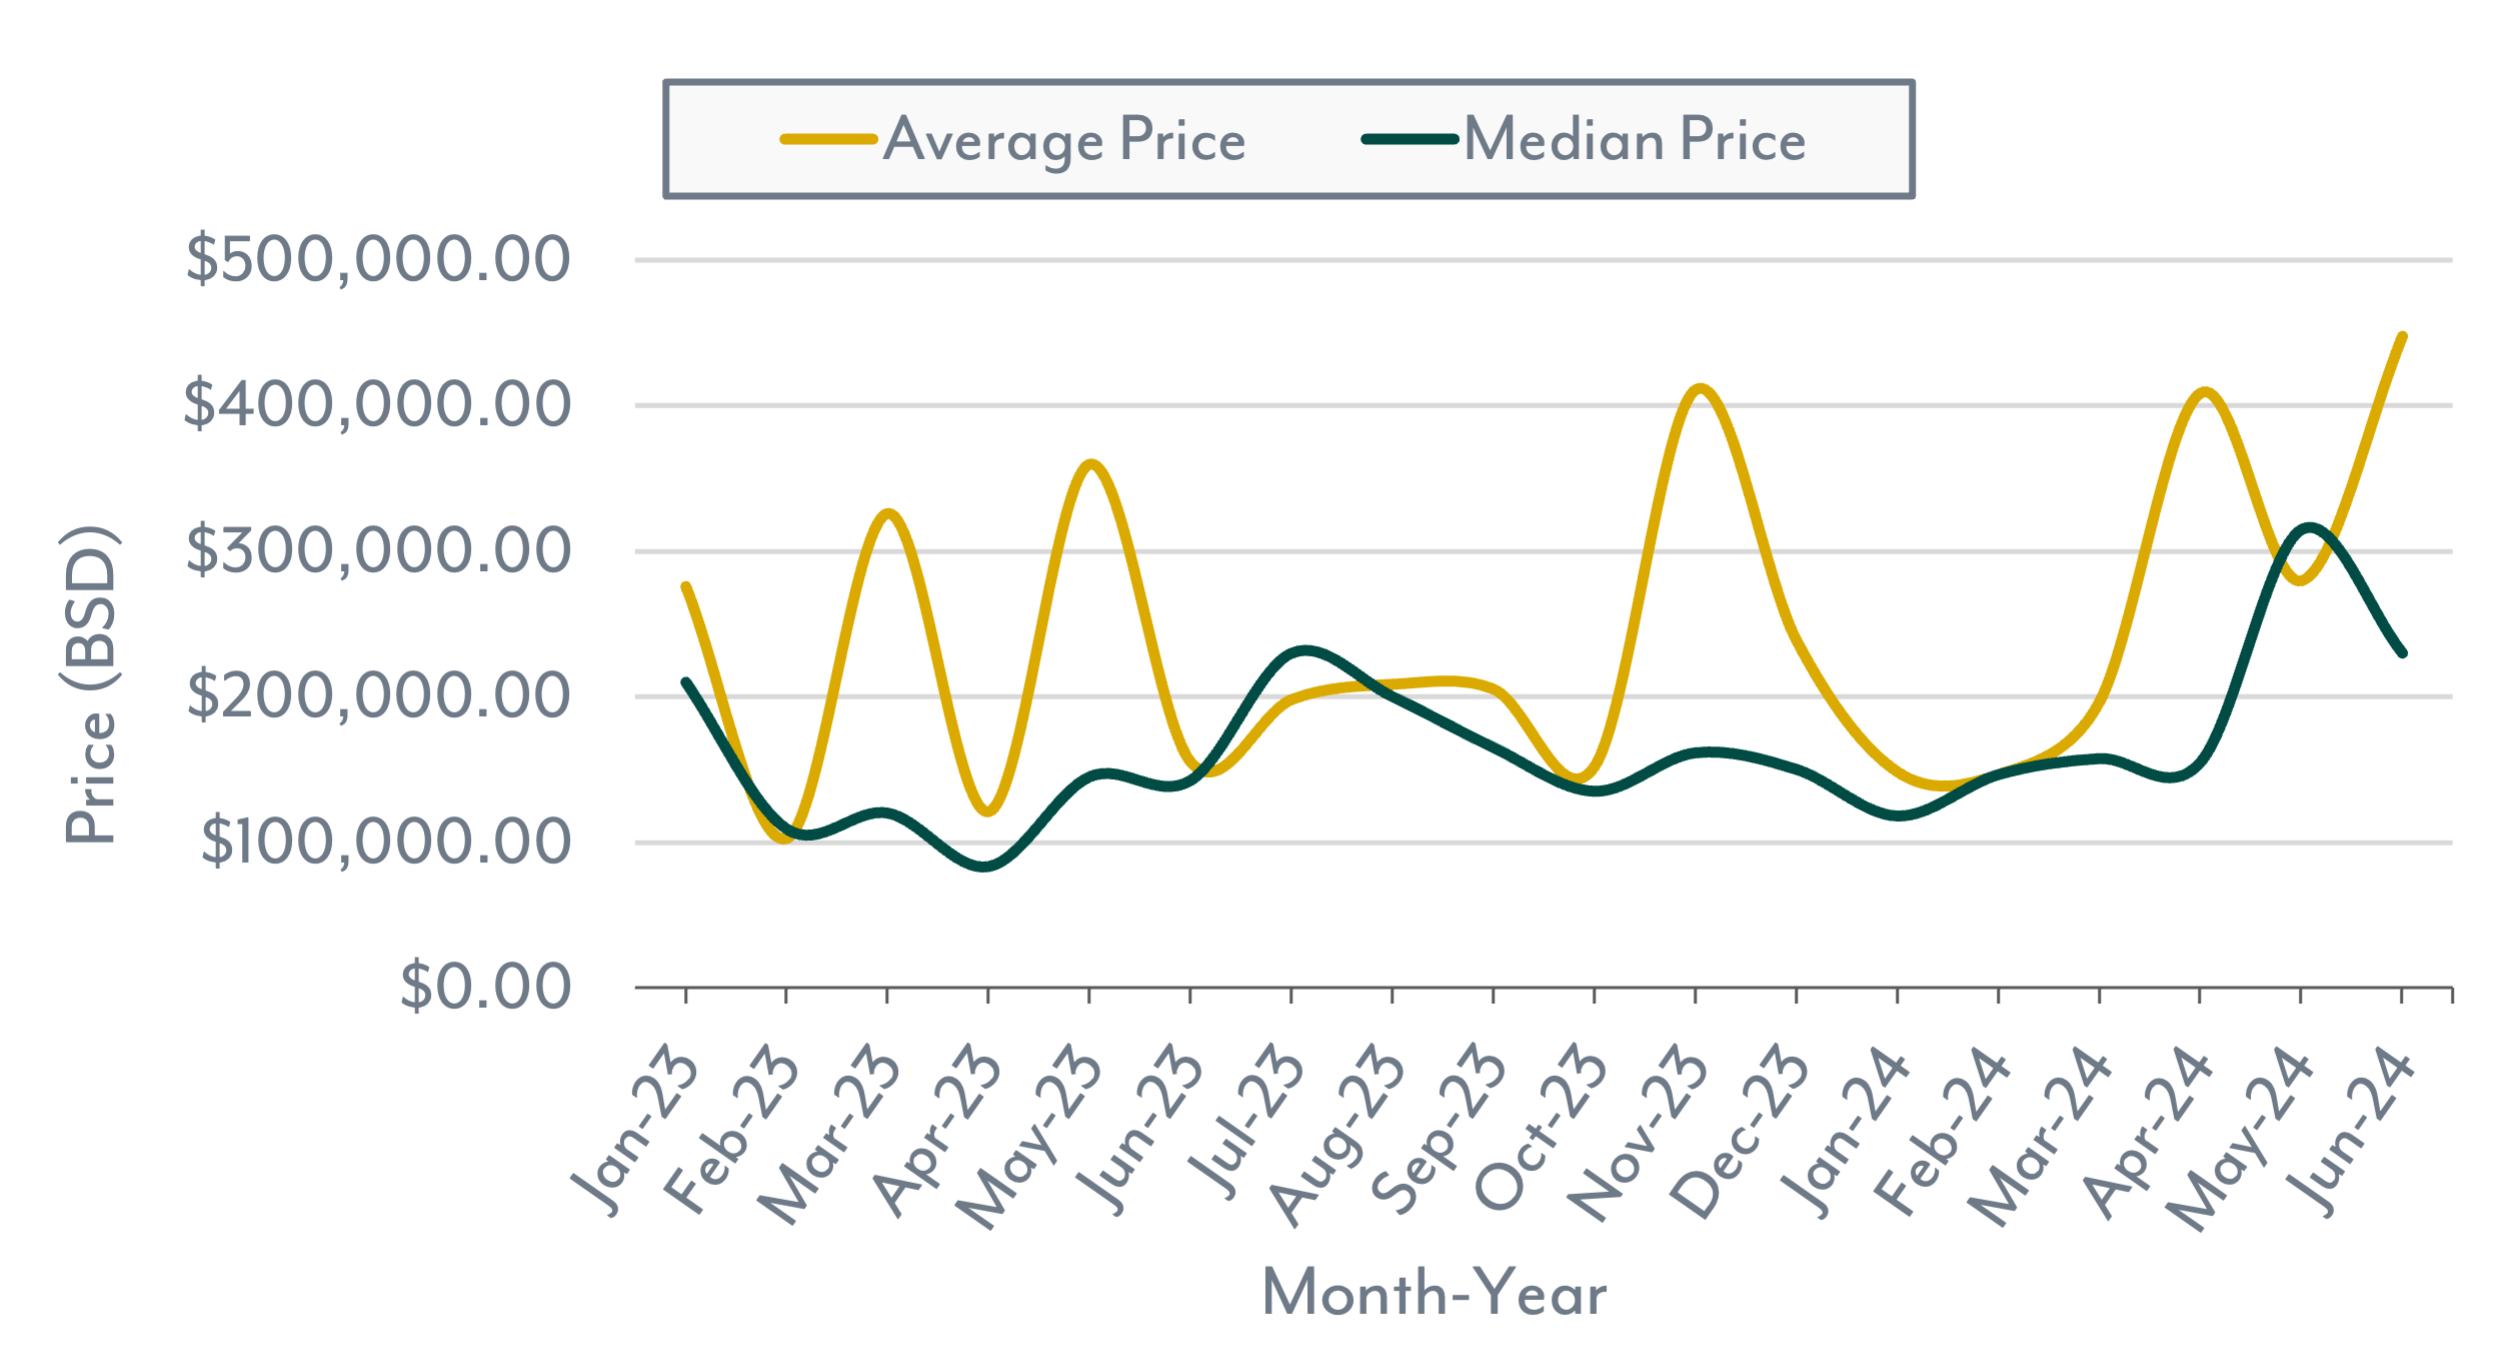
After last month’s price surge, prices have returned to 2023 levels. Both price variables show increases, with the Median Price being a more valid market indicator. YoY, the Median Price for sold homes rose by 83.9% and the Average Price by 91.6%. However, YTD comparisons show smaller increases, with the Median Price up 7.0% and the Average Price up 63.9%.
Days on the Market (DOM) remains low, with June 2024 marking the fastest sales period. Compared to June 2023, there was a 38.3% reduction in the time to sell a house. YTD comparisons also show a 17% reduction in 2024 compared to 2023.
Lastly, the Average List/Sale Price Ratio showed little change. YoY, there was a 1.6% decrease, indicating sellers were slightly more lenient with prices. While YTD comparisons showed a small increase of 0.8%.
Home Market Indicators
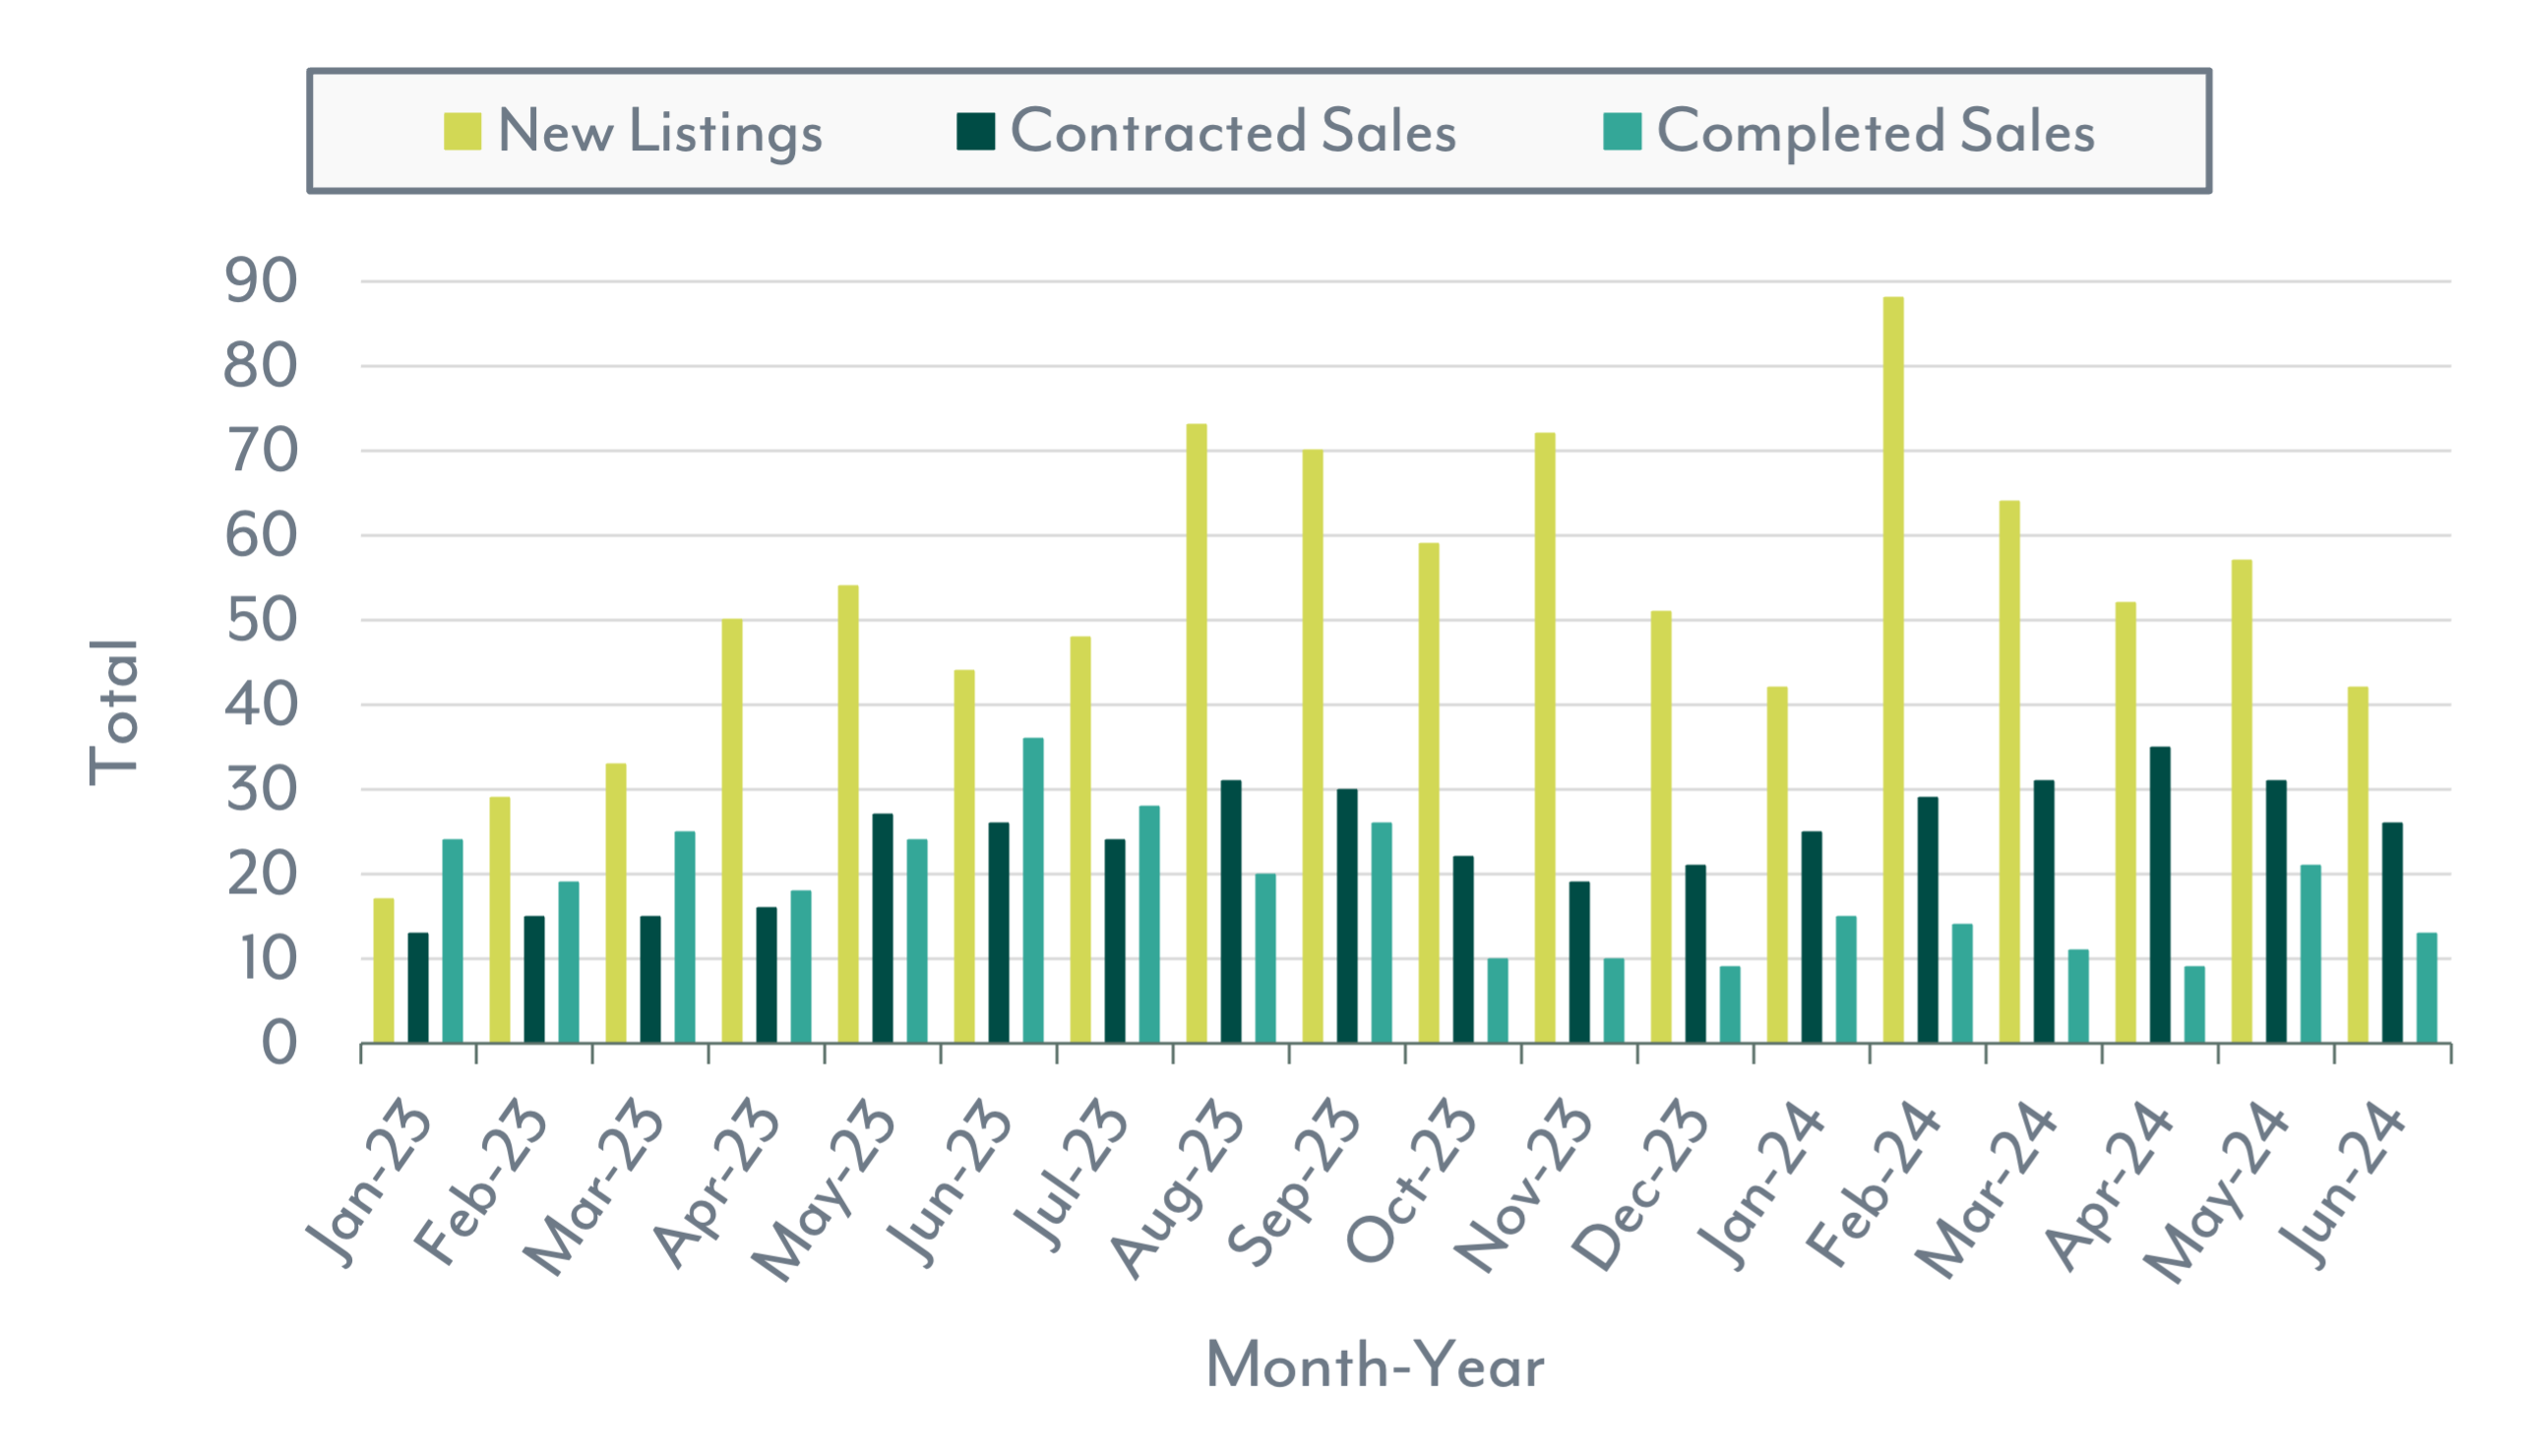
New Listings, Contracted Sales & Completed Sales
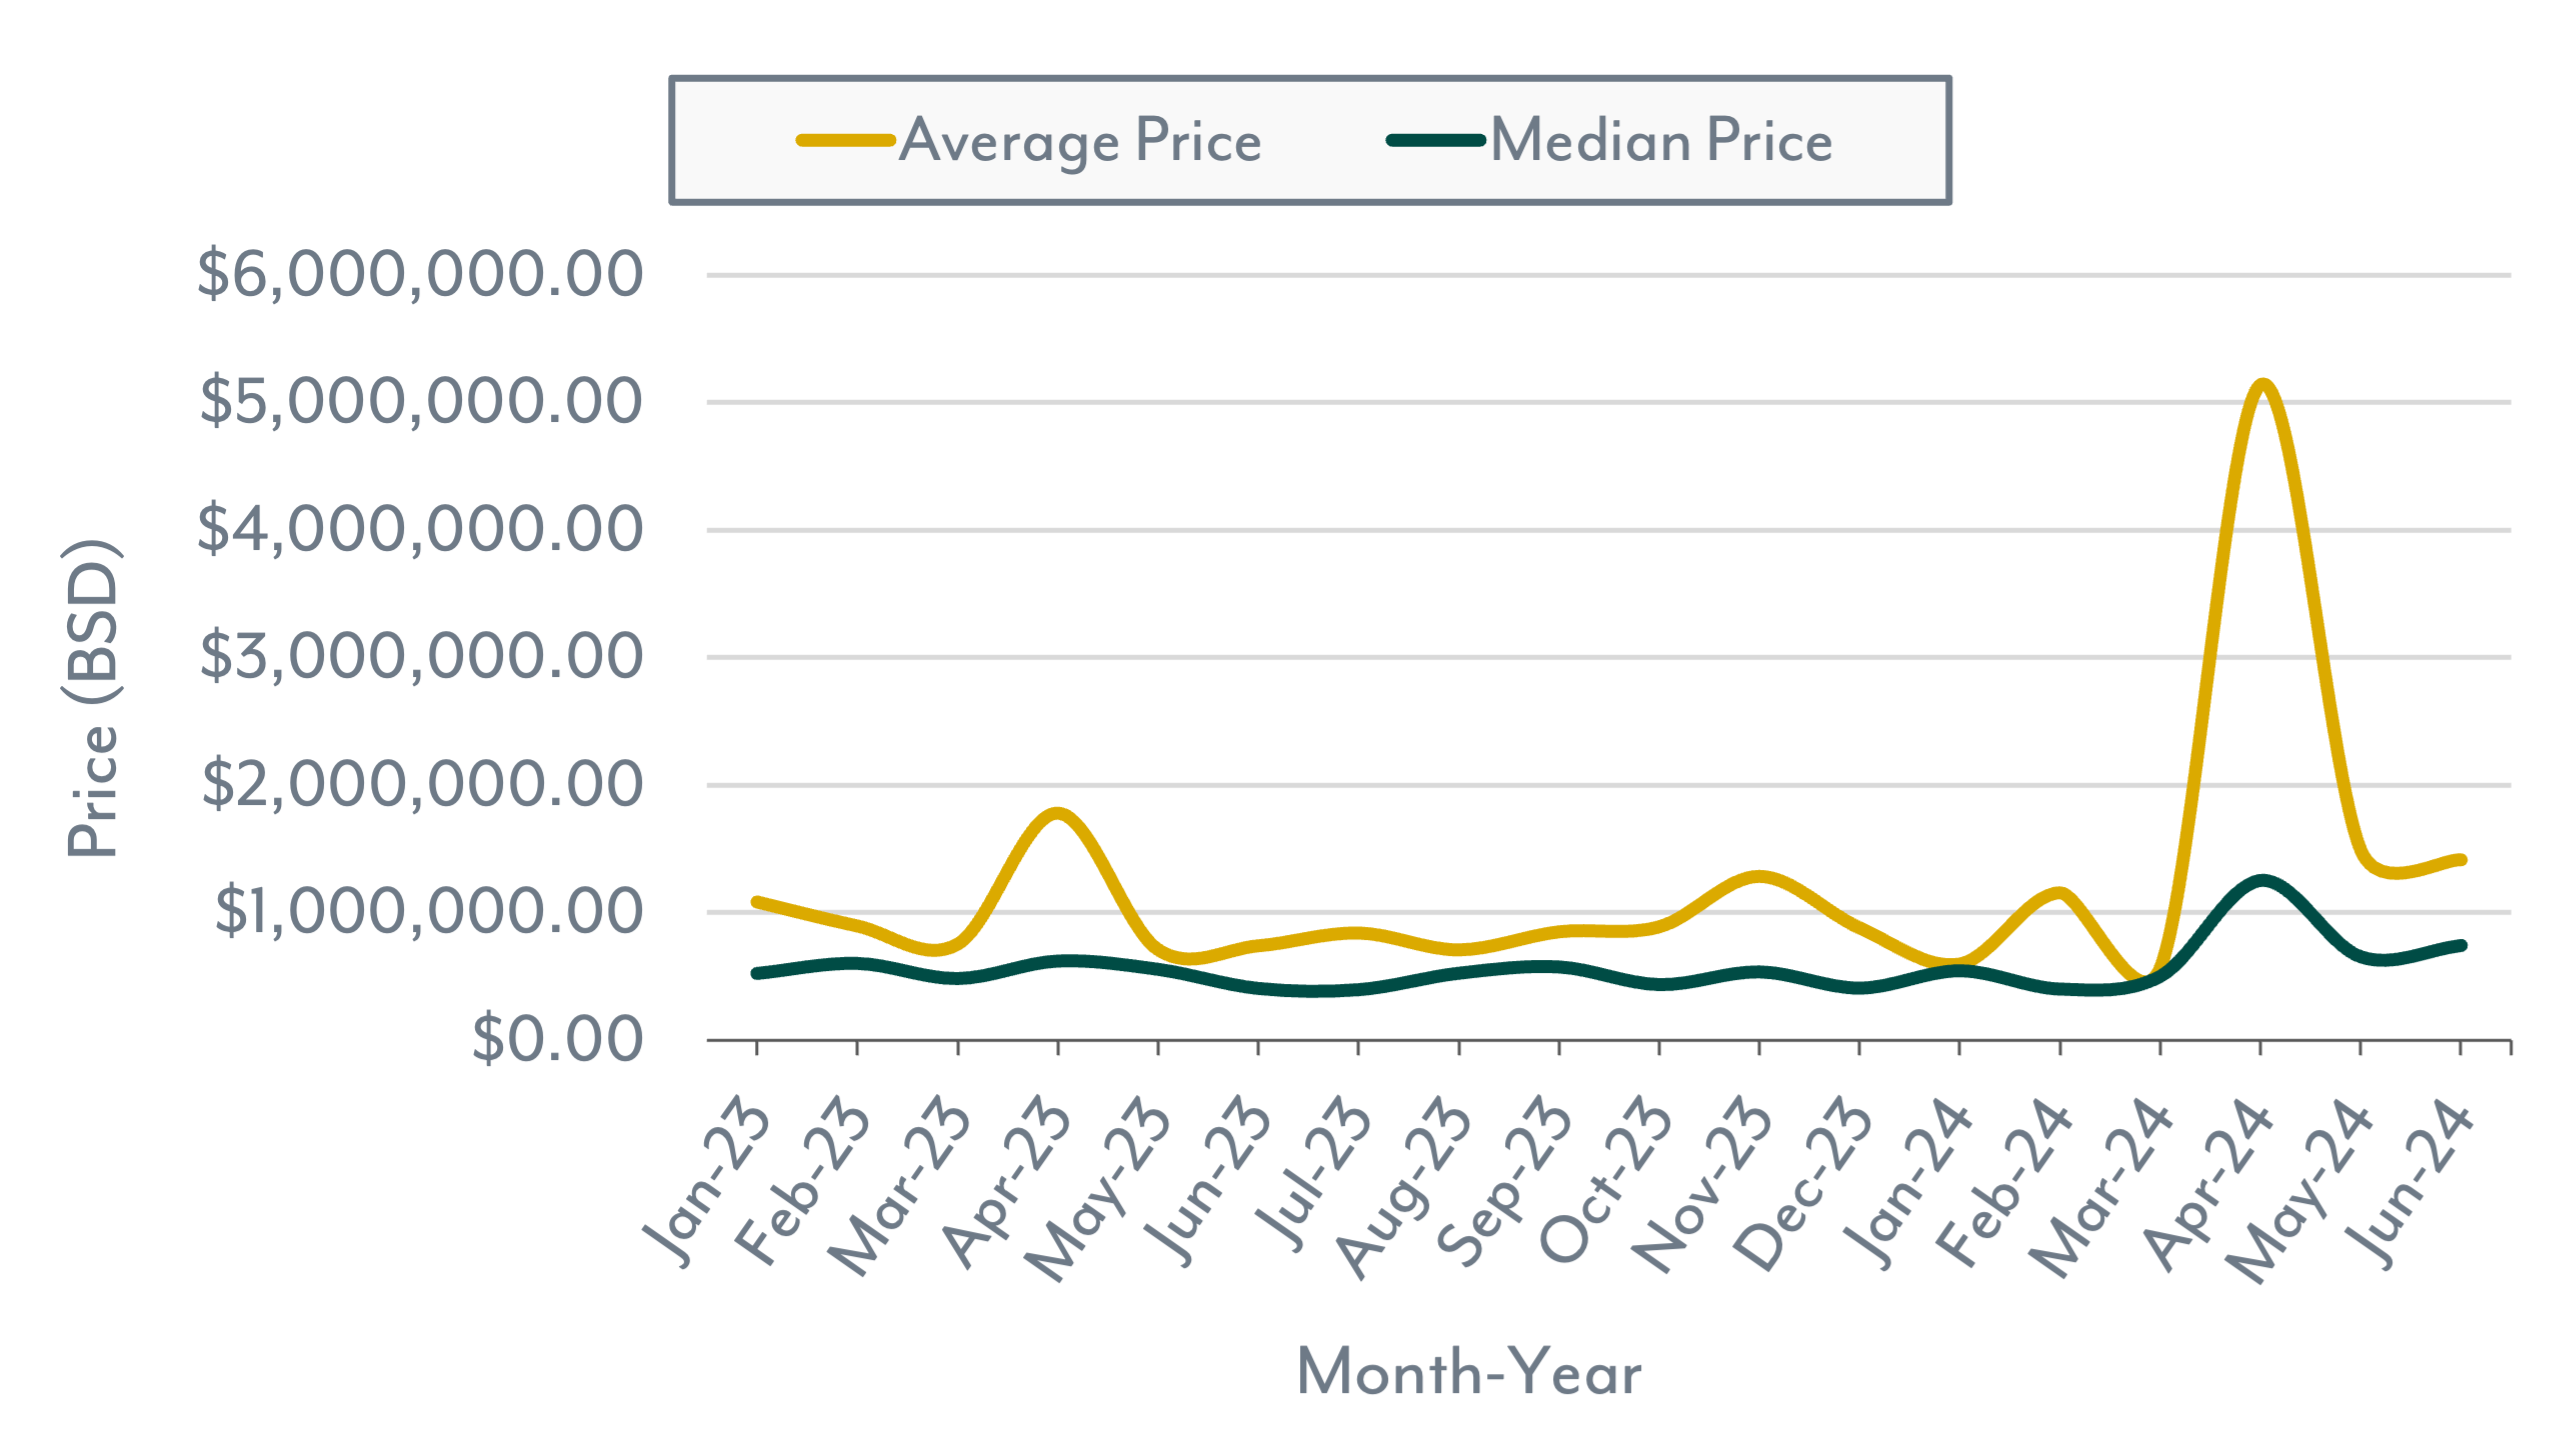
Average & Median Price

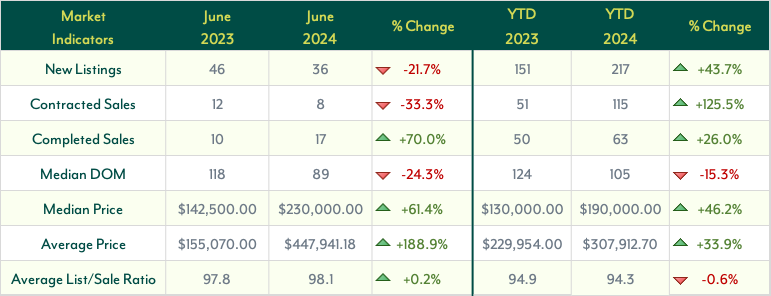
The Nassau and Paradise Island land market has exhibited trends over the past five months that align with previous observations. New Listings for land have decreased by 21.7% compared to June 2023, yet they are up 43.7% year-to-date (YTD). Despite this decline in New Listings, the volume of Contracted Sales has decreased by 33.3% year-over-year (YoY) but has increased significantly by 125.5% YTD, indicating a notable rise in demand in 2024 compared to 2023.
While Contracted Sales have declined, Completed Sales have increased substantially. YoY, Completed Sales rose by 70.0% in June 2024, and YTD, there has been a 26.0% increase. This growth in Completed Sales suggests a healthy level of market activity, despite the decrease in new listings.
After last month’s price adjustments, the price of land continues to increase. Both price variables indicate substantial growth, with the Median Price being a reliable market indicator. YoY, the Median Price for sold land increased by 61.4%, and the Average Price saw an even greater rise of 188.9%. However, YTD comparisons show more moderate increases, with the Median Price up 46.2% and the Average Price up 33.9%.
Days on the Market (DOM) for land have decreased, with June 2024 marking a faster sales period. Compared to June 2023, there was a 24.3% reduction in the time taken to sell land. YTD comparisons also show a 15.3% reduction in 2024 compared to 2023.
Lastly, the Average List/Sale Price Ratio for land has shown little change. YoY, there was a slight increase of 0.2%, indicating that sellers have maintained their pricing expectations. YTD comparisons, however, reveal a small decrease of 0.6%.
Land Market Indicators
New Listings, Contracted Sales & Completed Sales
Average & Median Price
Not sure if you are ready to buy or sell?
We're able to explain what these numbers mean for you and better guide you to make an informed decision that is best for you based on the current market conditions.