Nassau & Paradise Island Market Report - March 2025

Morley
We're Morley, a real estate company owned and operated by Bahamians with experience spanning four generations...
We're Morley, a real estate company owned and operated by Bahamians with experience spanning four generations...
Our monthly Market Report provides meaningful and valuable information, to empower buyers and sellers who are considering a real estate transaction in Nassau or Paradise Island (Bahamas).
If you're considering selling your property or buying property on Nassau or Paradise Island, it's essential to understand what's happening in The Bahamas' real estate market. Knowing the most important data, such as median and average prices, the number of properties sold, the number of new listings, and the days on the market will better prepare you for selling or buying.
We are happy to share our March 2025 analysis of the Nassau and Paradise Island market. We also encourage you to review our quarterly market reports on Abaco, Eleuthera, Exuma, Grand Bahama and New Providence.
Our market reports provide Morley's interpretation of the data from the Bahamas Real Estate Association MLS. Even though the MLS does not include all real estate sales and related real estate data, we believe the MLS data is reasonable and consistent to be reliable to use to estimate local real estate trends.

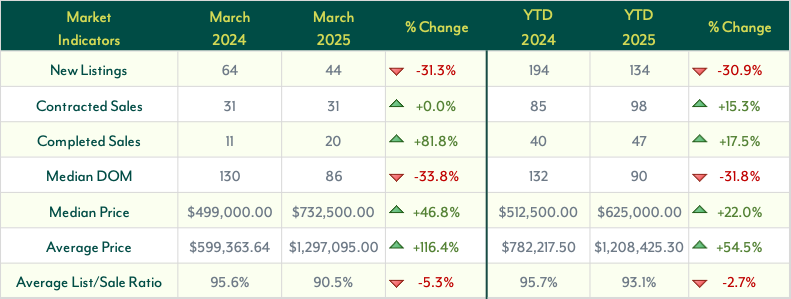
The Nassau and Paradise Island housing market in March 2025 saw a noticeable decline in new listings, a steady demand for properties, and continued price increases.
New Listings dropped 31.3% year-over-year (YoY) to just 64 properties, indicating a tightening supply. Year-to-date (YTD), new listings also fell by 30.9%, further underscoring concerns about limited inventory.
Despite the reduced supply, demand remained strong. Contracted Sales stayed consistent YoY with 31 properties under contract, but YTD figures saw a 15.3% increase, reaching 98 transactions compared to 85 last year, signaling greater buyer activity.
Completed Sales saw impressive growth, jumping 81.8% YoY to 20 sales in March. The YTD increase of 17.5% (47 sales vs. 40 last year) highlights a consistent upward trend in final transactions.
Homes were moving quickly off the market, with the Median Days on Market (DOM) decreasing by 33.8% YoY to 86 days. YTD DOM also improved by 31.8%, dropping from 132 days to 90, indicating faster sales cycles.
Home prices continued their upward trajectory. The Median Sales Price rose 46.8% YoY to $732,500, while the Average Sales Price surged by 116.4% to $1,297,095. YTD, the median price increased 22.0%, reaching $625,000, while the average price rose 54.5% to $1,208,425, reflecting growing demand for higher-end properties.
Sellers experienced a slight softening in pricing power, with the Average List-to-Sale Price Ratio declining by 5.3% YoY to 90.5%. The YTD ratio also dropped by 2.7%, indicating some flexibility in negotiations.
Overall, March 2025 reflected a competitive housing market, with limited inventory, strong demand, and rising prices. Looking ahead, supply constraints and affordability concerns will likely play a key role in shaping future market trends.
Home Market Indicators
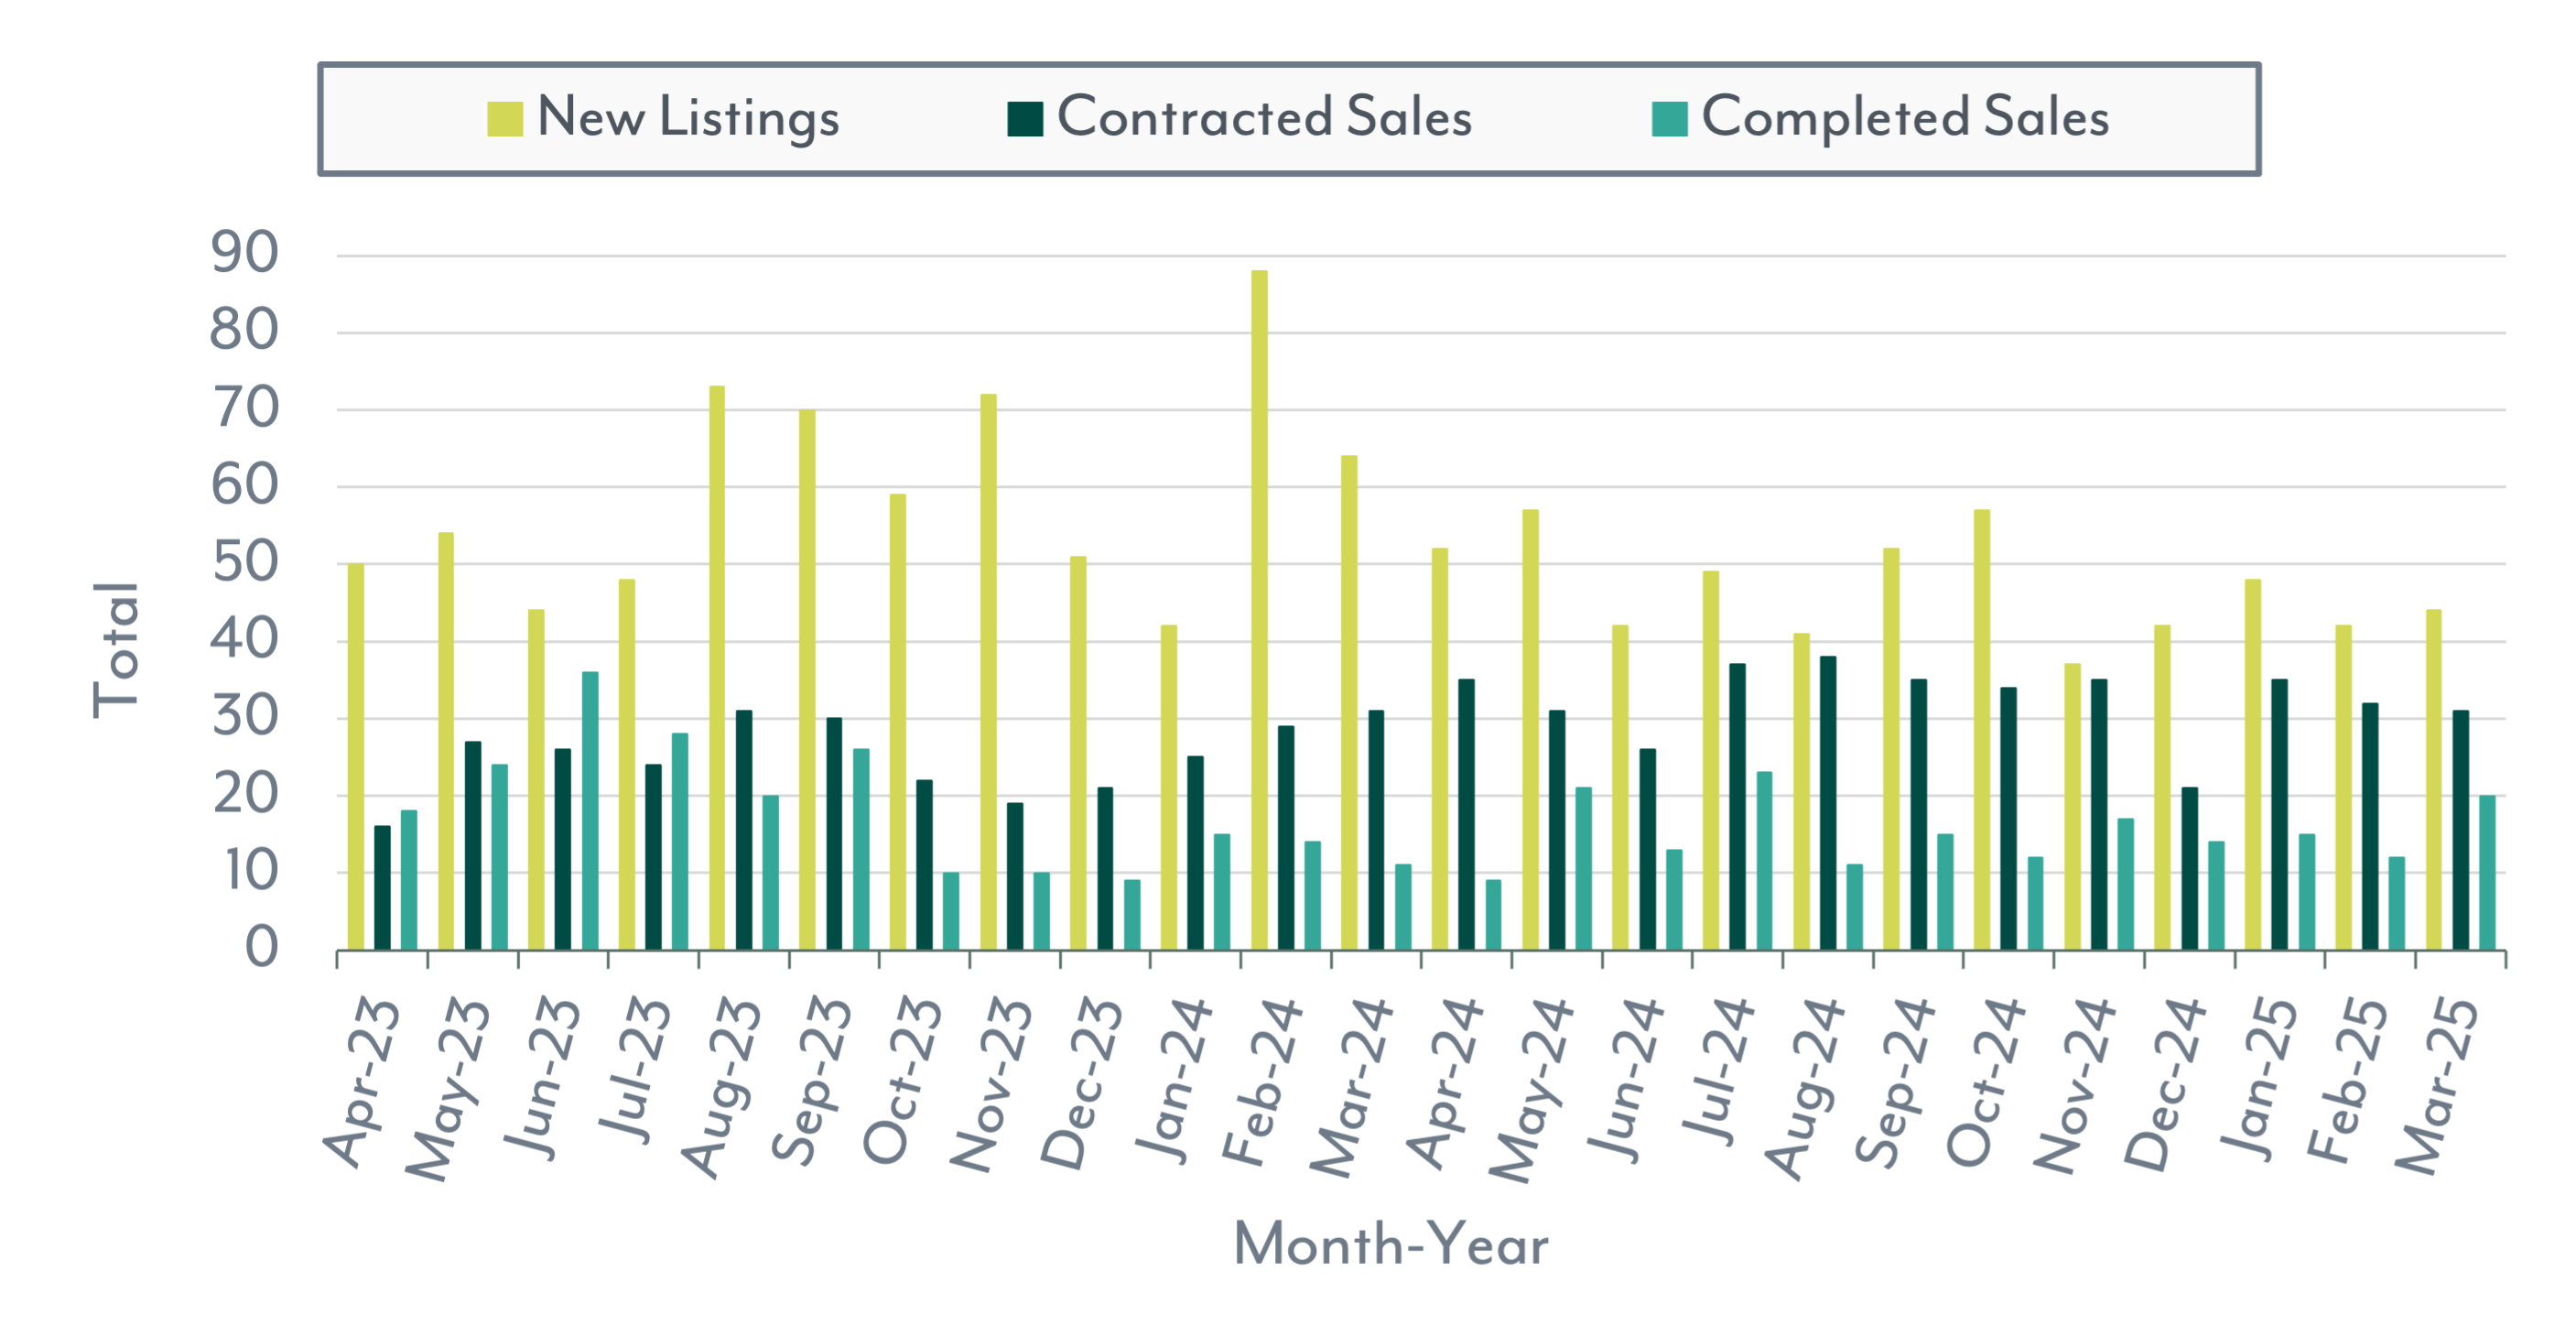
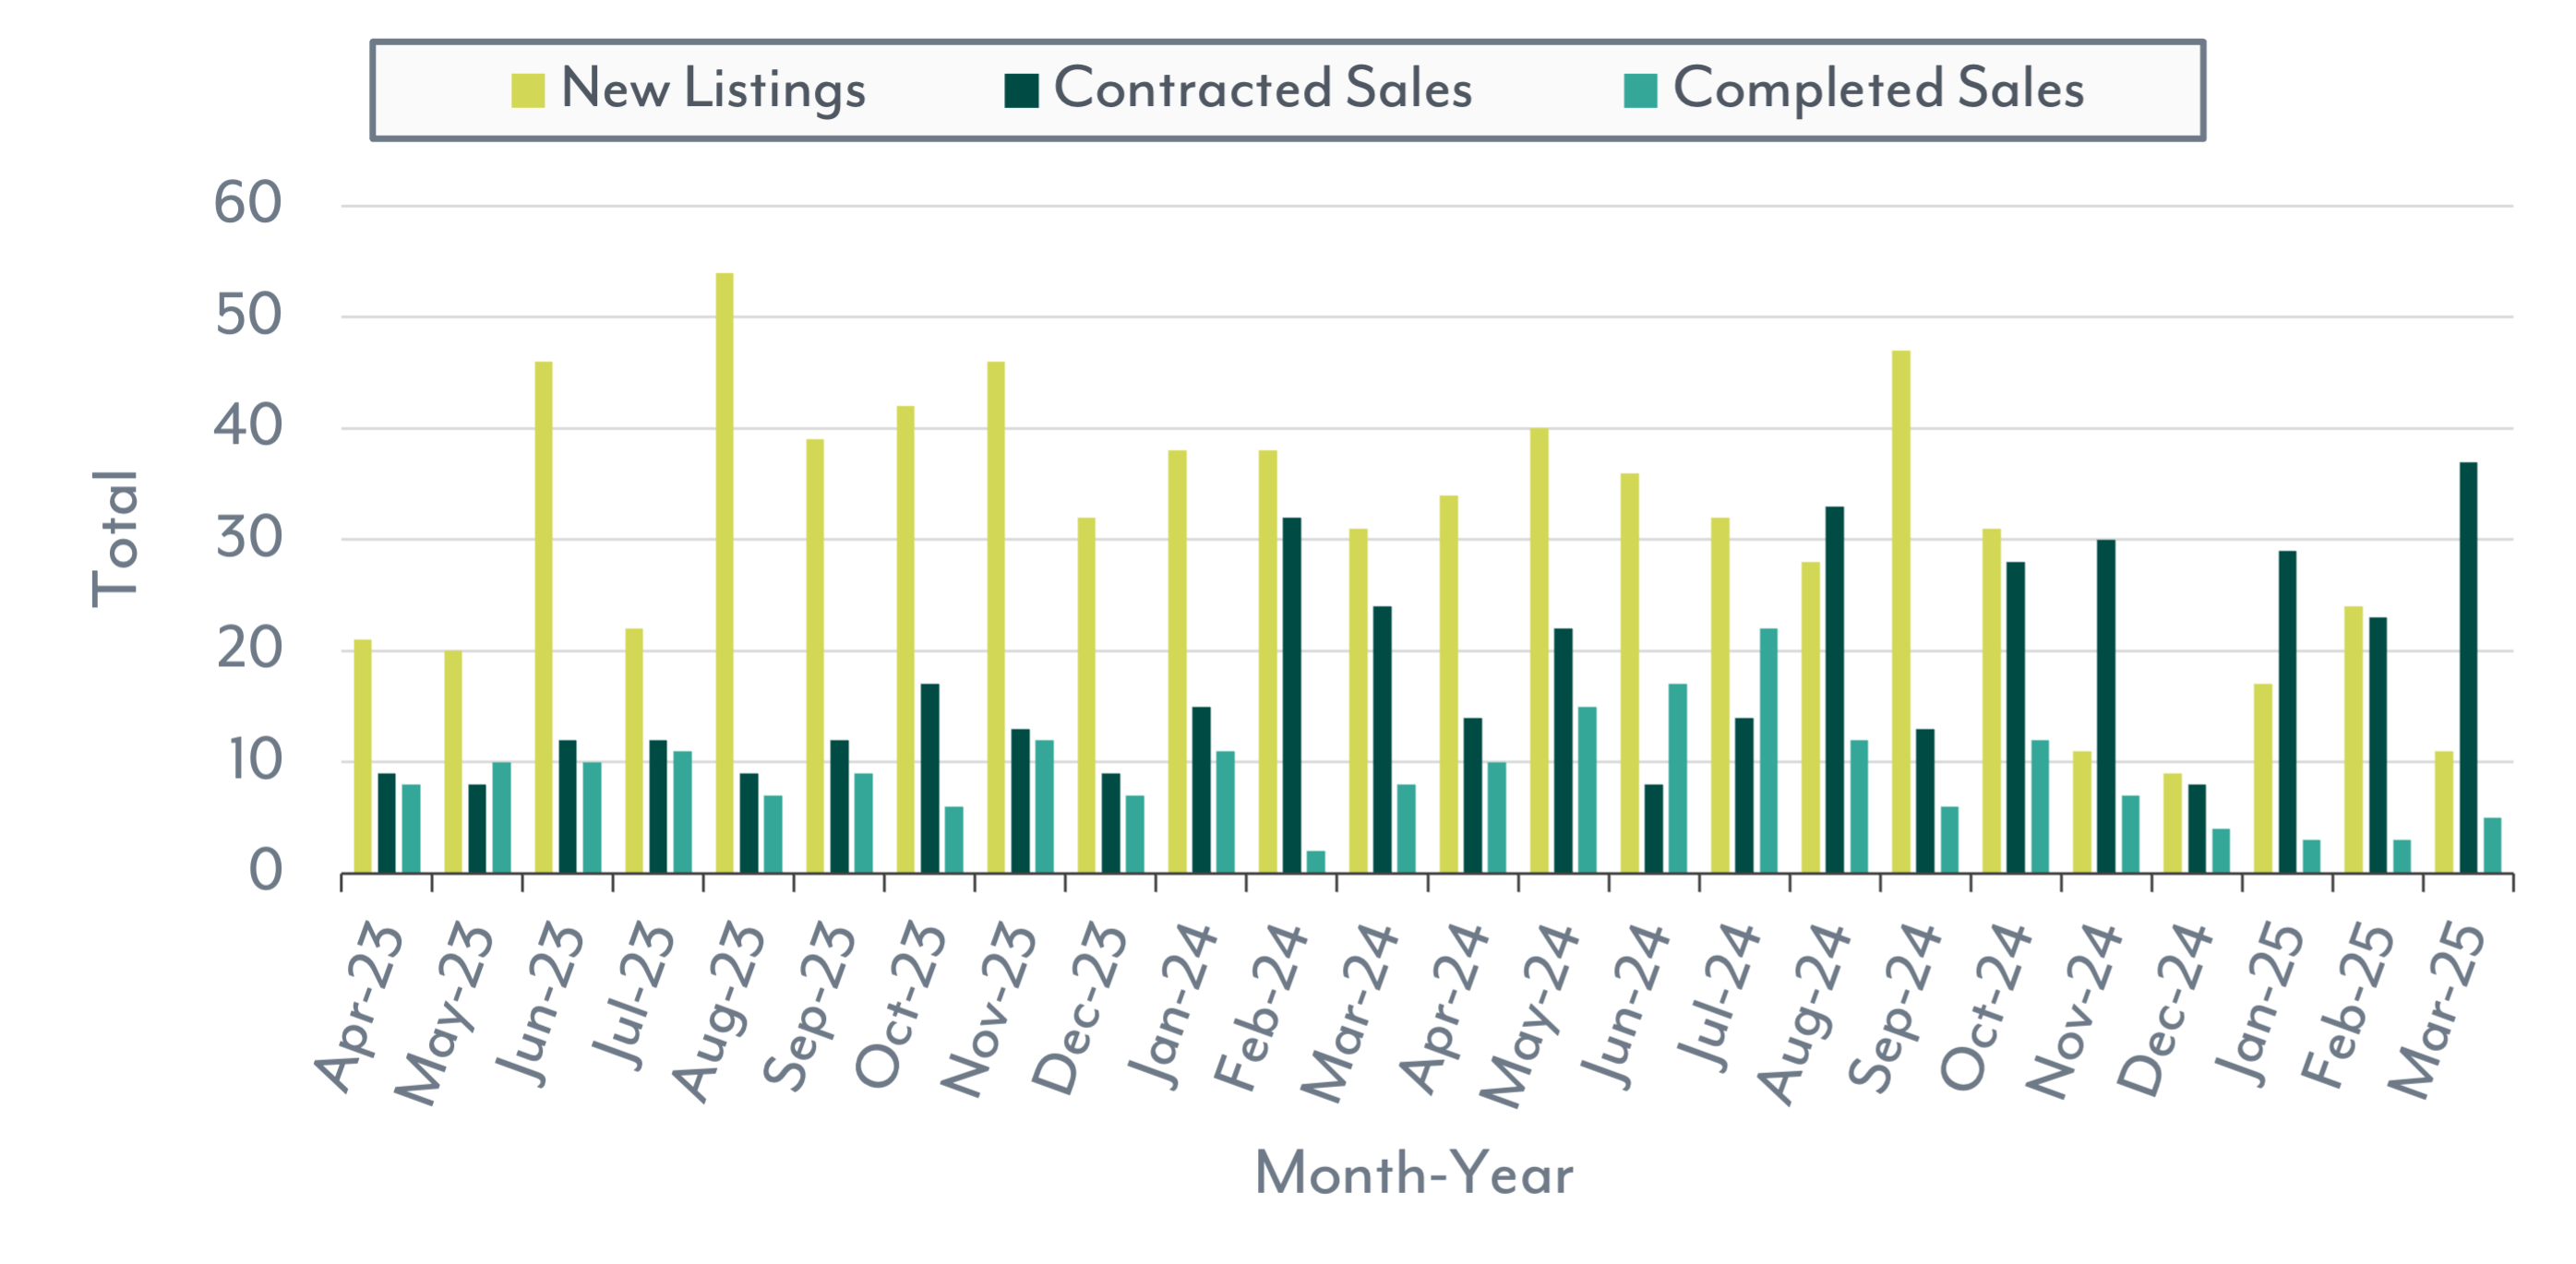
New Listings, Contracted Sales & Completed Sales
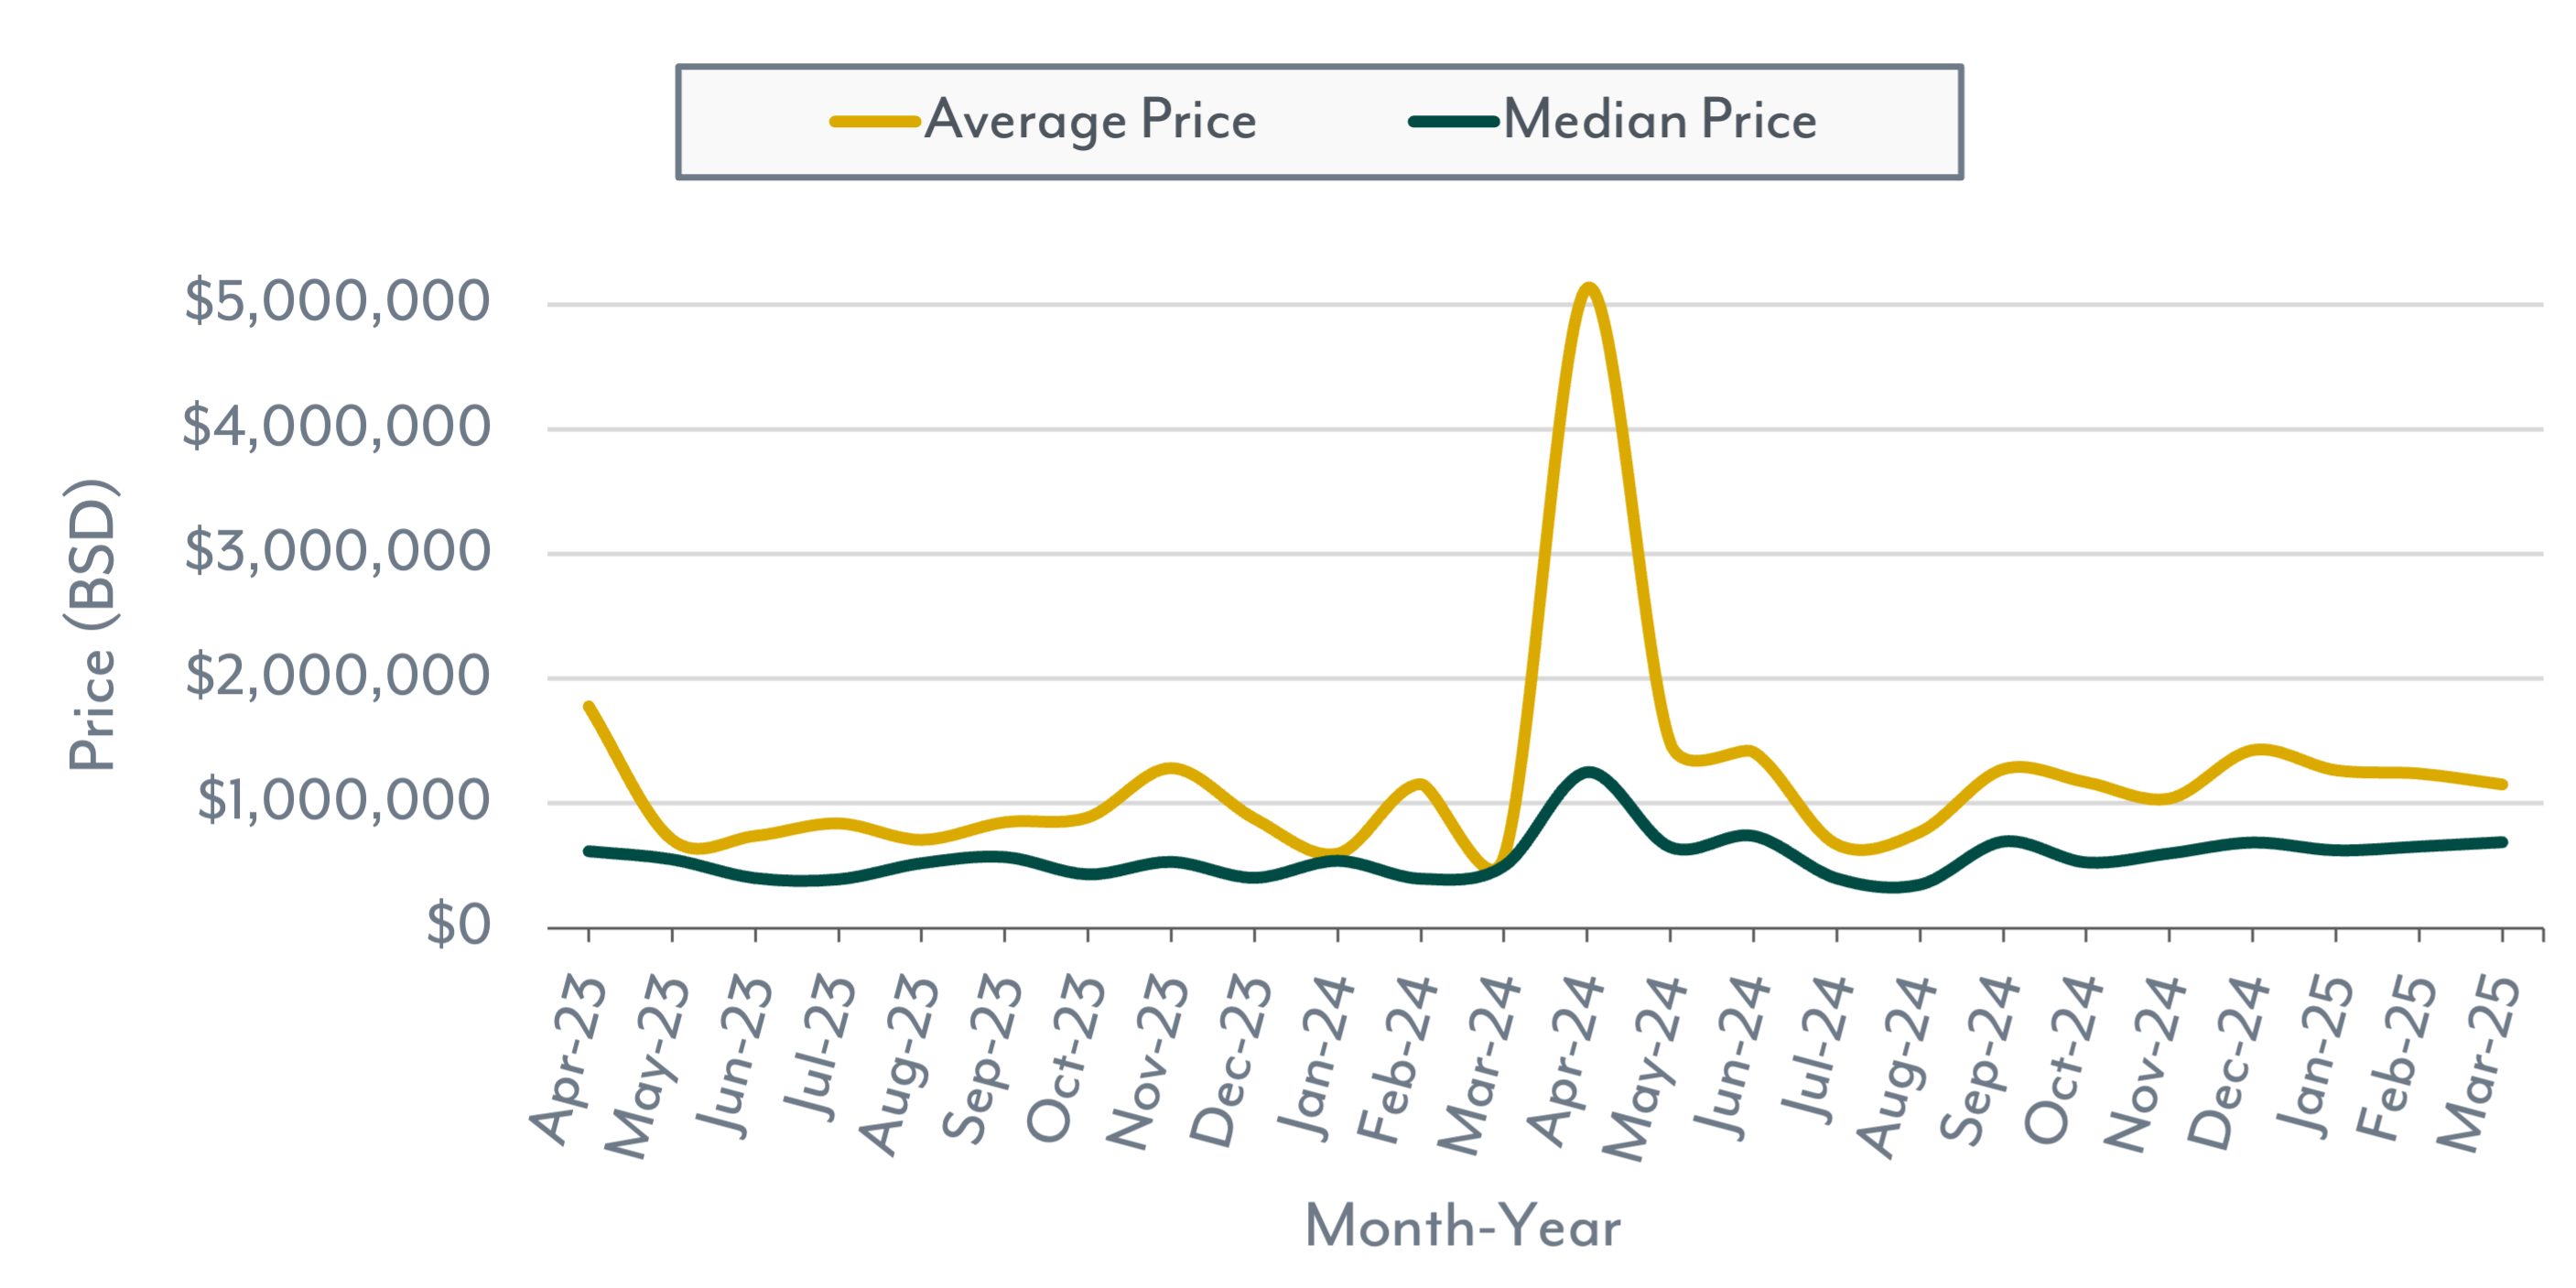
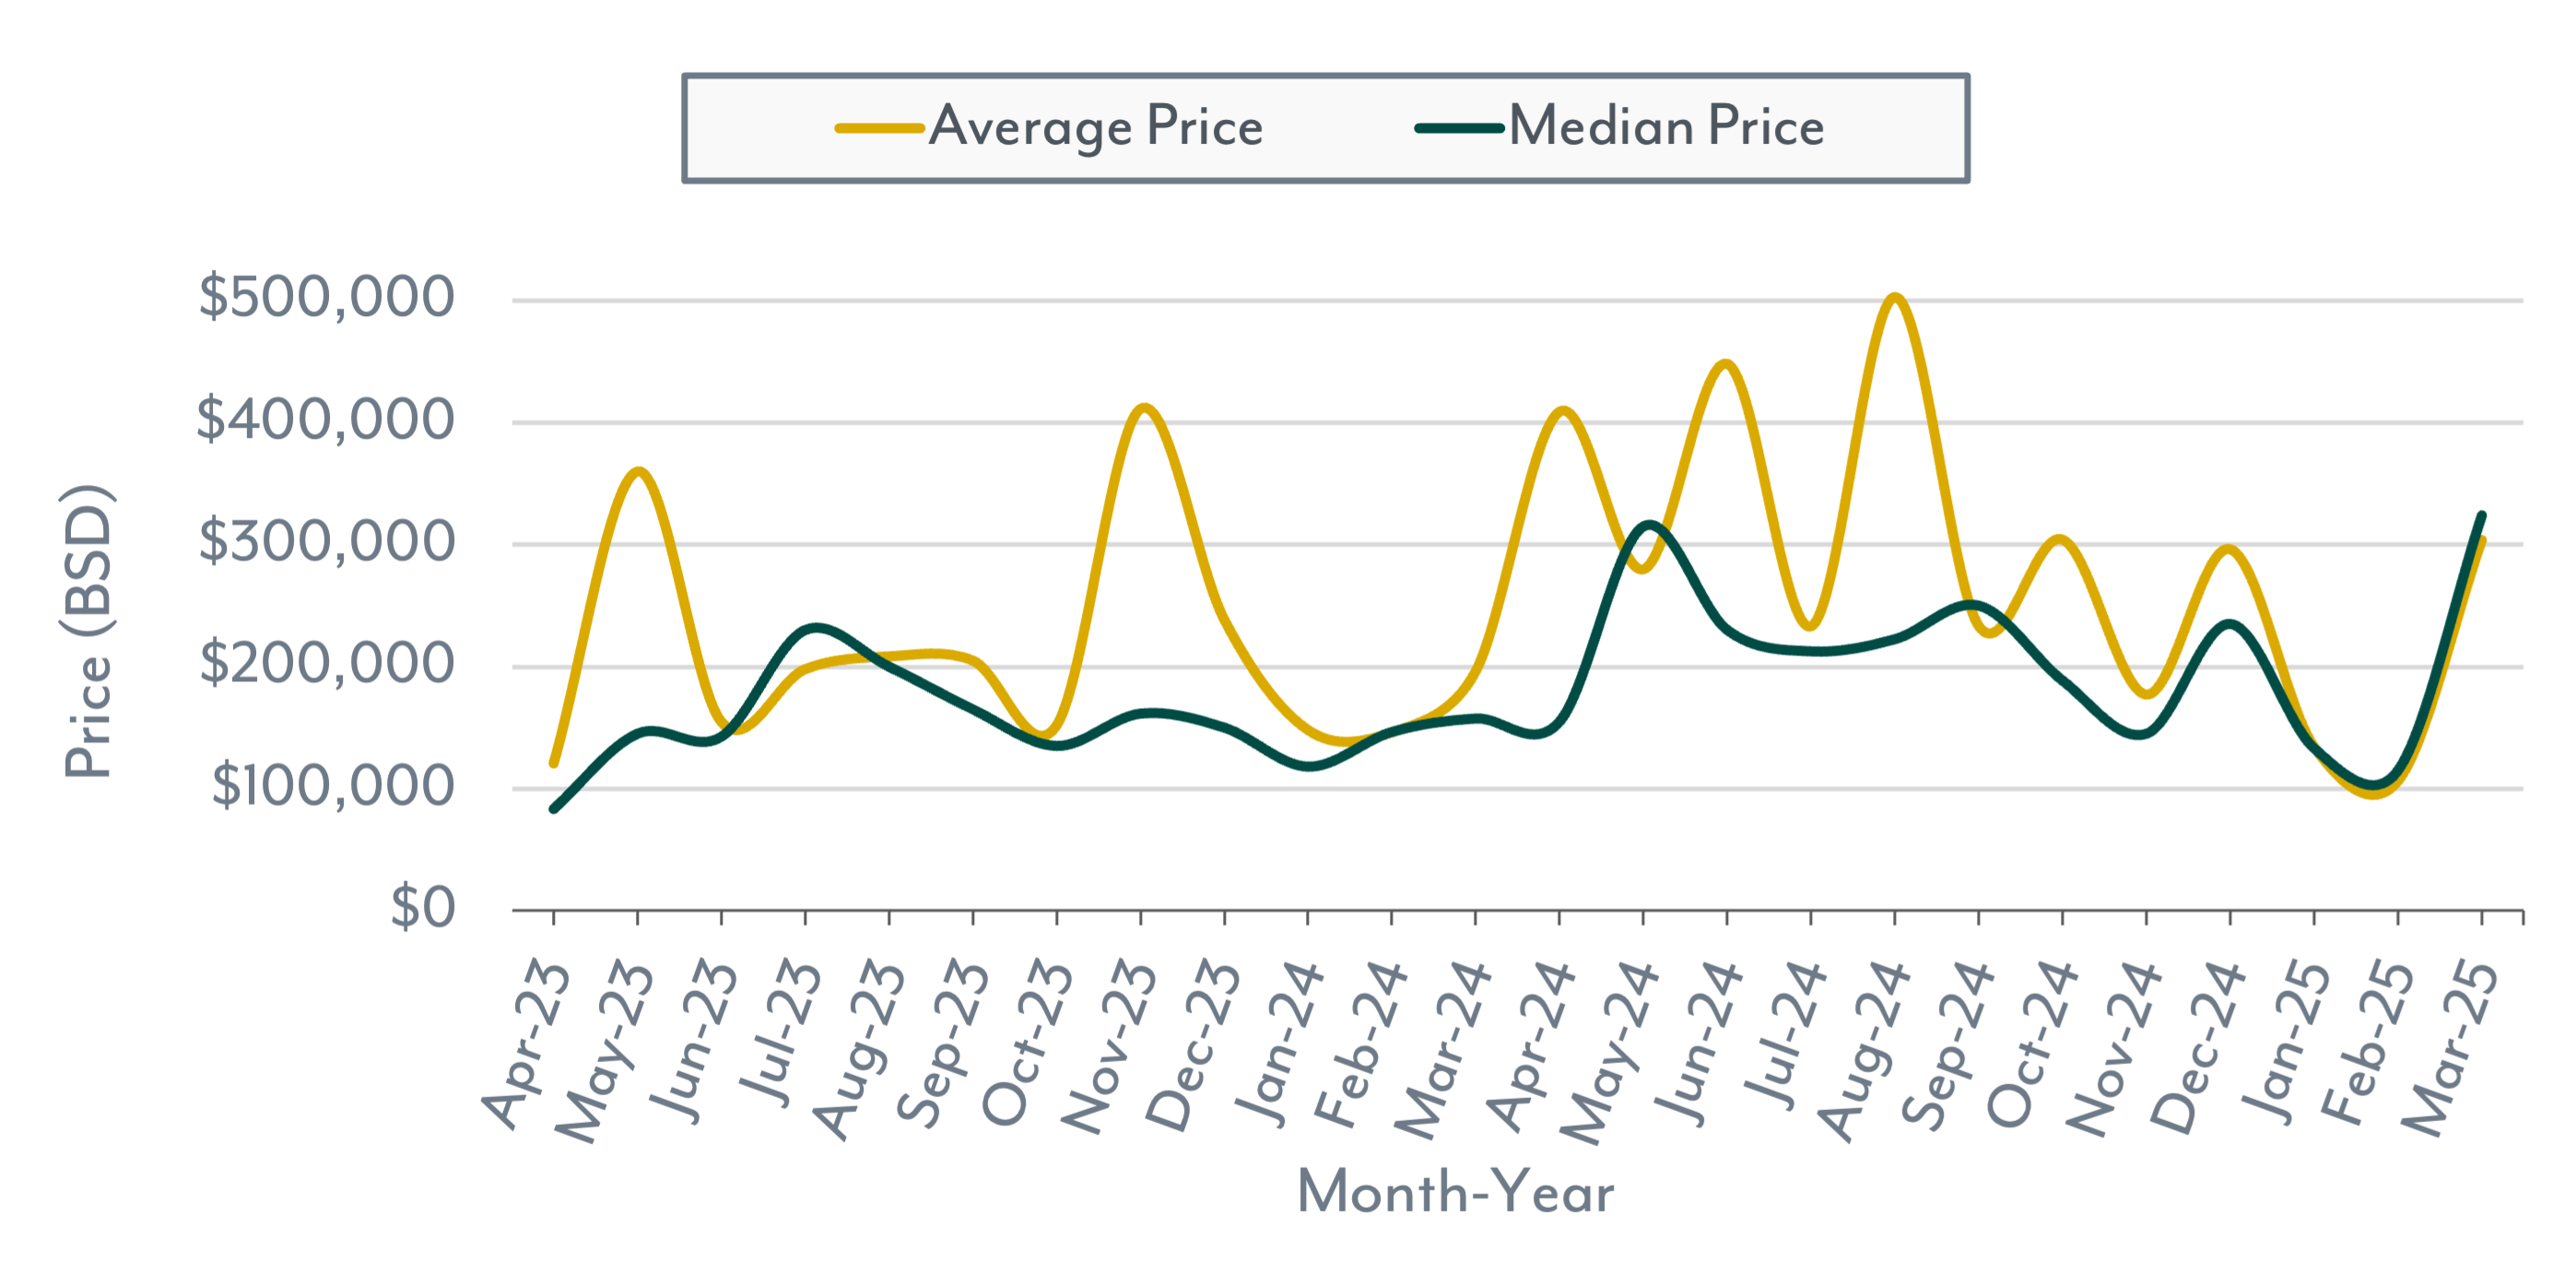
Average & Median Price

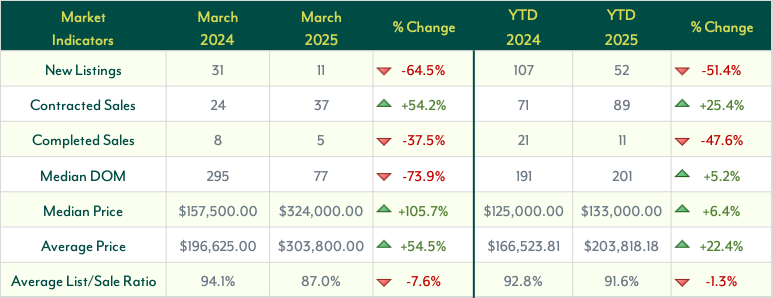
The Nassau and Paradise Island land market in March 2025 reflected similar shifts in inventory, sales activity, and pricing trends.
New Listings saw a sharp decline, dropping 64.5% year-over-year (YoY) to 11 properties, signaling a continued tightening of supply. Year-to-date (YTD), listings were down 51.4%, showing that fewer landowners are entering the market — likely due to seller hesitation or limited new development.
Despite the reduced supply, buyer demand remained strong. Contracted Sales surged 54.2% YoY to 37 transactions, and YTD figures showed a 25.4% increase, indicating sustained interest from buyers. However, Completed Sales dropped 37.5% YoY to 5 transactions, and YTD figures saw a 47.6% decline, pointing to some variability in final deal closures.
Market timing showed an accelerated pace, with the Median Days on Market (DOM) falling 73.9% YoY to 77 days, suggesting properties are selling much faster. YTD, DOM increased by 5.2%, indicating some fluctuation in transaction timelines.
Pricing trends indicated strong growth, with the Median Sales Price more than doubling, rising 105.7% YoY to $324,000. The Average Sales Price also increased 54.5%, reaching $303,800. YTD figures mirrored this upward trend, with the median price up 6.4% to $133,000, and the average price climbing 22.4% to $203,818, reflecting growing confidence in land values.
Sellers saw some softening in negotiation power, with the Average List-to-Sale Price Ratio decreasing by 7.6% YoY to 87.0%. YTD, this metric dropped by 1.3%, suggesting a slight shift in market dynamics.
Overall, March 2025 highlighted a land market characterized by tight inventory, rising demand, and strong price growth. The faster pace of sales and increasing valuations point to a competitive environment, though declining completed transactions and shifting price ratios suggest that some sellers may need to adjust their expectations as the market evolves.
Land Market Indicators
New Listings, Contracted Sales & Completed Sales
Average & Median Price
Not sure if you are ready to buy or sell?
We're able to explain what these numbers mean for you and better guide you to make an informed decision that is best for you based on the current market conditions.