Nassau & Paradise Island Market Report - November 2024
Our monthly Market Report provides meaningful and valuable information, to empower buyers and sellers who are considering a real estate transaction in Nassau or Paradise Island (Bahamas).
If you're considering selling your property or buying property on Nassau or Paradise Island, it's essential to understand what's happening in The Bahamas' real estate market. Knowing the most important data, such as median and average prices, the number of properties sold, the number of new listings, and the days on the market will better prepare you for selling or buying.
We are happy to share our November 2024 analysis of the Nassau and Paradise Island market. We also encourage you to review our quarterly market reports on Abaco, Eleuthera, Exuma, Grand Bahama and New Providence.
Our market reports provide Morley's interpretation of the data from the Bahamas Real Estate Association MLS. Even though the MLS does not include all real estate sales and related real estate data, we believe the MLS data is reasonable and consistent to be reliable to use to estimate local real estate trends.

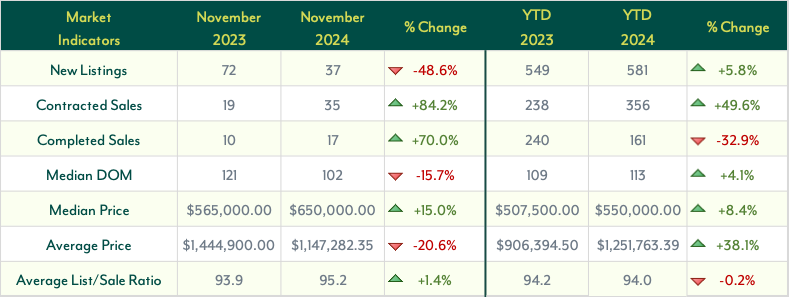
The Nassau and Paradise Island housing market in November 2024 reflects a mix of strong buyer demand and inventory constraints, with notable changes in key metrics compared to last year.
The number of New Listings in November saw a 48.6% YoY decline, dropping to 37 listings, though YTD figures show a 5.8% increase. This year-to-date growth highlights continued market interest this year, but the monthly decline signals a potential tightening in new inventory.
Contracted Sales jumped significantly by 84.2% YoY, totaling 35, showcasing the increased buyer activity. Similarly, Completed Sales rose by 70.0% YoY to 17, while YTD completed sales have declined 32.9%. Even though YTD completed sales are down in 2024, we see quite the opposite for contracted sales as they rose 49.6% YTD.
The Median Days on Market (DOM) remained very similar to what this market is used to. Only dropping 15.7% YoY to 102 days, indicating faster sales processes. YTD figures show a small 4.1% increase, averaging 113 days. With the drop in new listings, we might expect homes to sit on the market for less time.
On the pricing front, the Median Sales Price climbed by 15.0 % YoY to $650,000.00, while the Average Sales Price dropped 20.6% YoY to $1,147,282.35, telling us that fewer high-end properties were sold during this past month. YTD, the Median Price is up 8.4%, and the Average Price has increased by 38.1%.
Lastly, the Average List-to-Sale Ratio increased by 1.4% YoY, settling at 95.2%, suggesting sellers are a bit firmer on their sales prices. YTD, this ratio has declined slightly by 0.2%, telling us that 2023 and 2024 have remained very similar.
Home Market Indicators
New Listings, Contracted Sales & Completed Sales
Average & Median Price

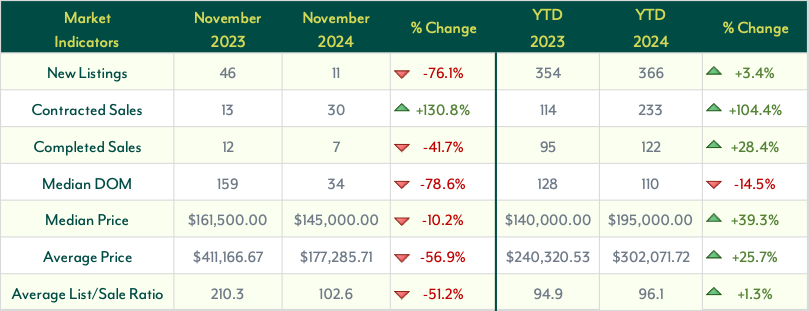
The Nassau and Paradise Island land market experienced a mixed set of trends in November 2024, reflecting strong buyer interest alongside constraints in new inventory.
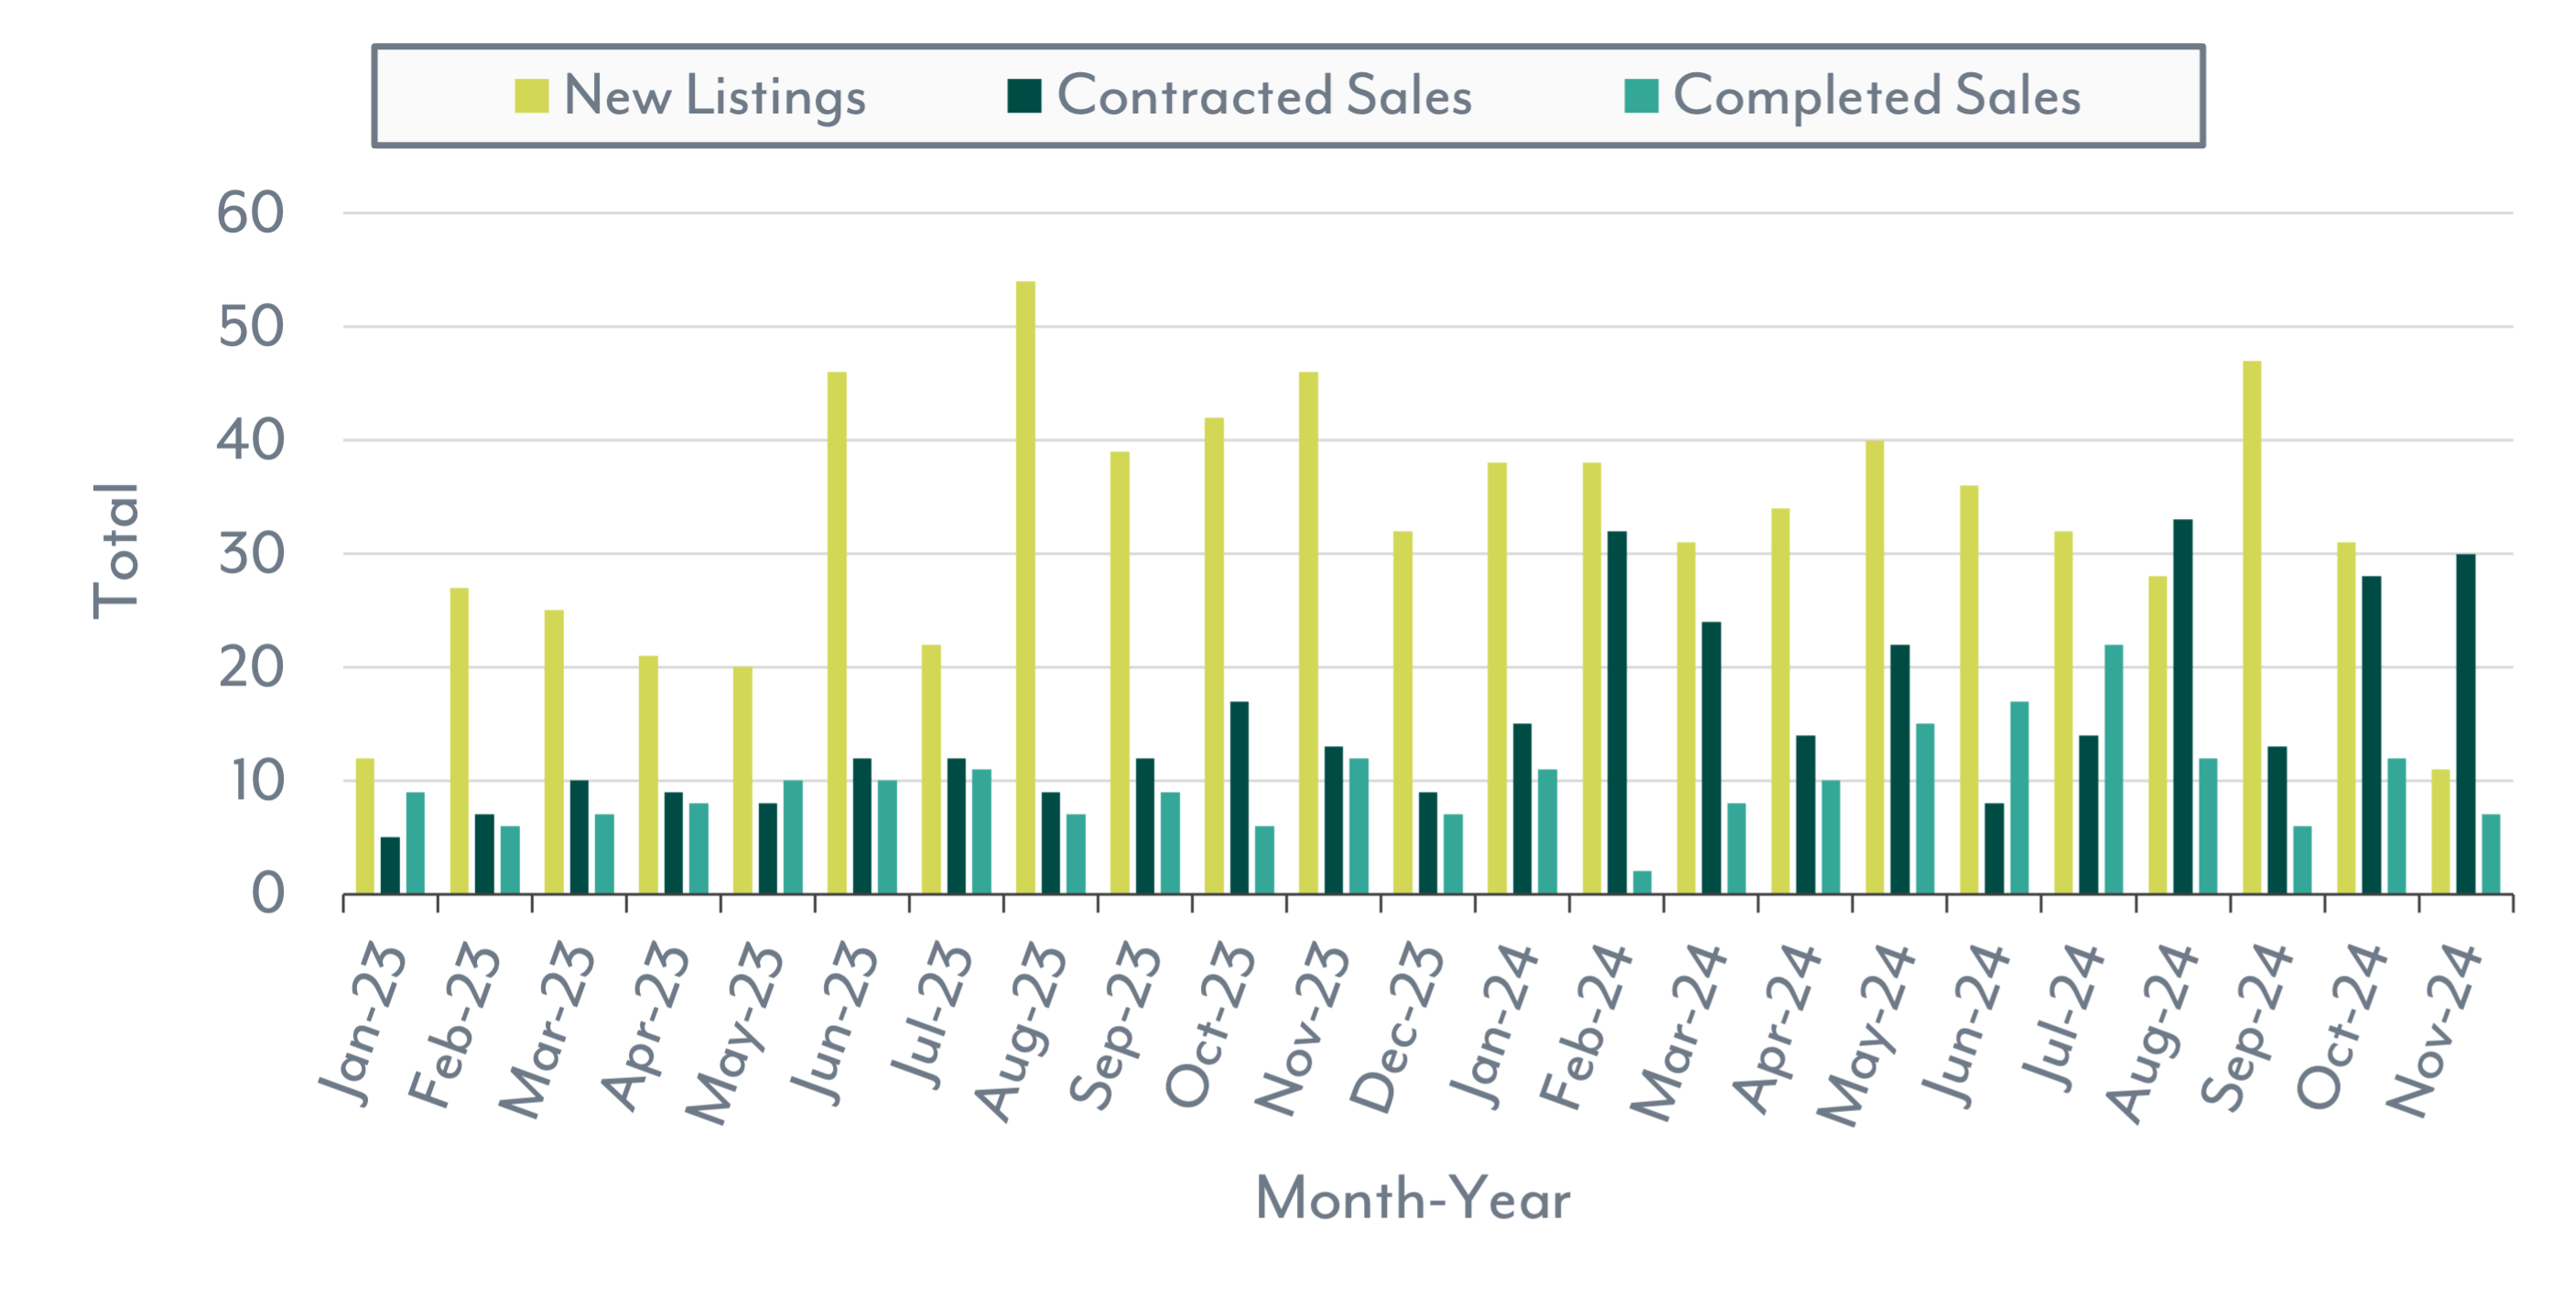
New Listings dropped sharply by 76.1% YoY to 11 in November 2024, marking a significant reduction compared to last year and last month’s figure. However, YTD New Listings have increased by 3.4%, indicating that while November saw a dip in fresh inventory, the broader trend for 2024 remains slightly positive for new listings.
Contracted Sales soared by 130.8% YoY to 30, underscoring a robust demand for land as more buyers actively entered into contracts. YTD Contracted Sales show an impressive 104.4% increase, highlighting the strength of buyer activity throughout the year.
The number of Completed Sales fell by 41.7% YoY to 7 in November 2024, potentially impacted by the reduction in new listings. Despite this decline, YTD Completed Sales have grown by 28.4%, demonstrating continued improvement in finalized transactions over the year.
Median Days on Market (DOM) dropped significantly by 78.6% YoY to 34 days in November, suggesting that properties are selling much faster compared to the same period last year. The YTD Median DOM declined by 14.5%, averaging 110 days, showing that properties are moving slightly faster overall in 2024.
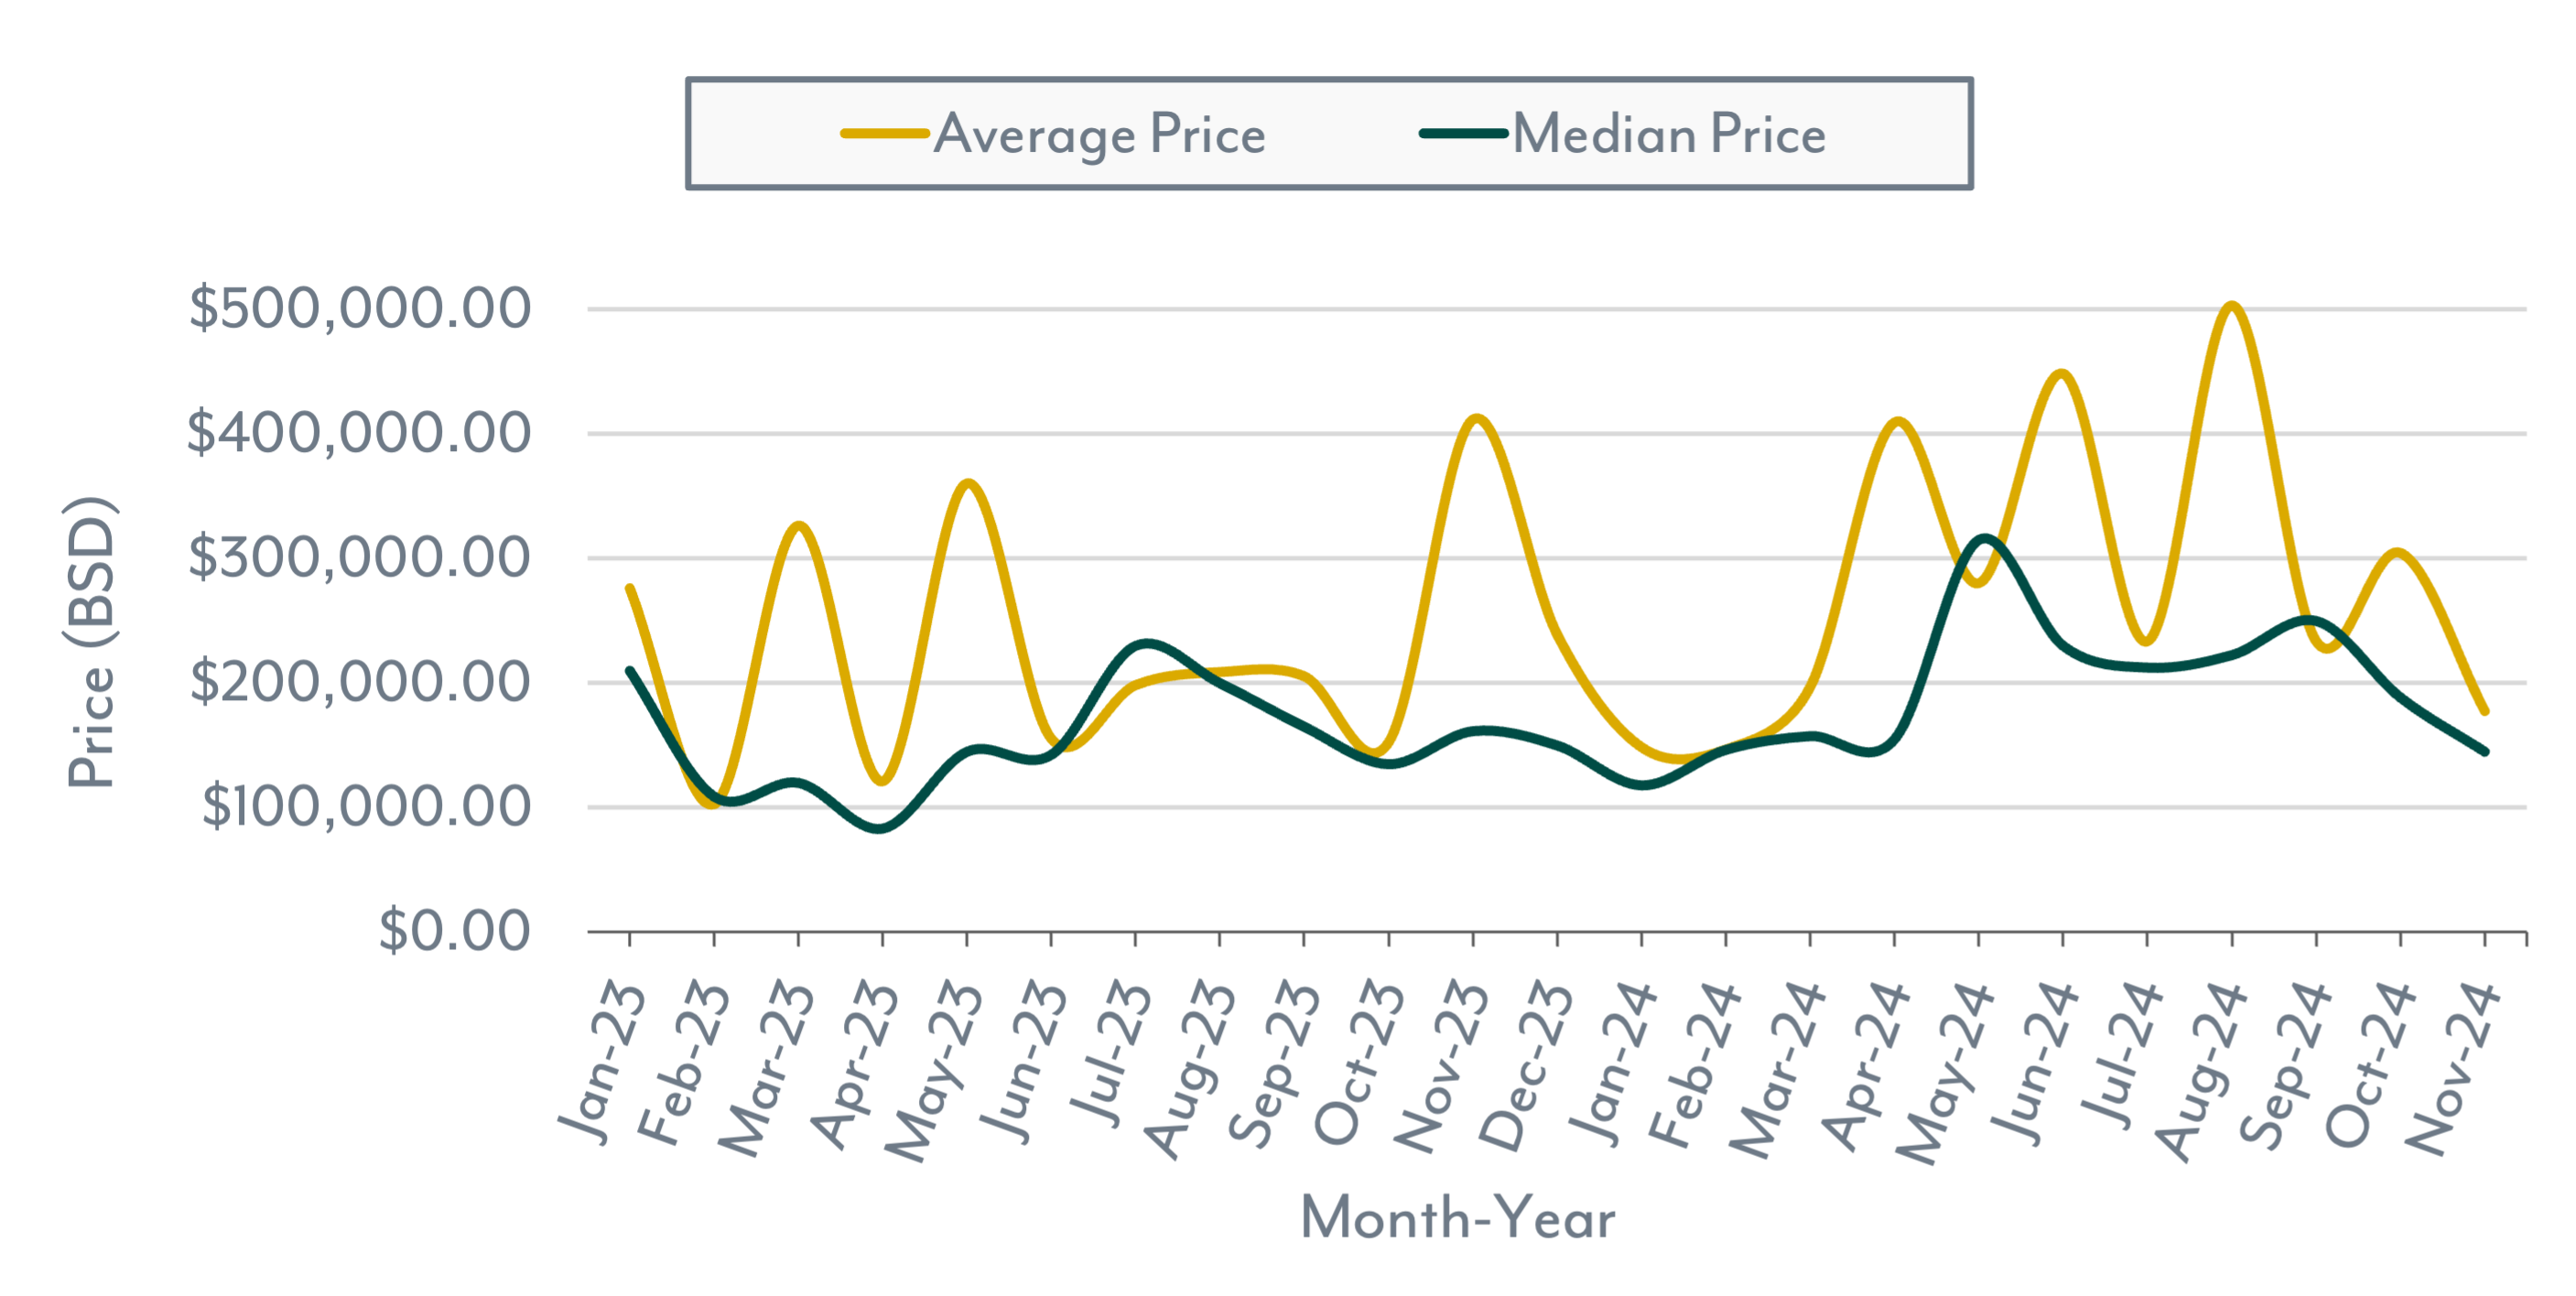
Prices showed some shifts. The Median Price dropped by 10.2% YoY to $145,000.00 in November, but YTD figures remain strong with a 39.3% increase, reaching $195,000.00. Similarly, the Average Price decreased by 56.9% YoY to $177,285.71, while YTD Average Price rose by 25.7%, reflecting an ongoing trend of price growth for the year despite November’s decline.
Lastly, the Average List-to-Sale Price Ratio rose by 0.7% YoY, increasing to 94.9 in November 2024. This suggests that sellers are reacting in a similar way to how they were this time last year. Nevertheless, the YTD ratio has shown a slight increase of 1.3%, averaging 96.1.
November’s market dynamics reflect strong buyer demand in Contracted Sales but reveal ongoing inventory challenges, evidenced by declines in New Listings and Completed Sales. These factors continue to shape the trends seen across 2024.
Land Market Indicators
New Listings, Contracted Sales & Completed Sales
Average & Median Price
Not sure if you are ready to buy or sell?
We're able to explain what these numbers mean for you and better guide you to make an informed decision that is best for you based on the current market conditions.


