Our monthly Market Report provides meaningful and valuable information, to empower buyers and sellers who are considering a real estate transaction in Nassau or Paradise Island (Bahamas).
If you're considering selling your property or buying property on Nassau or Paradise Island, it's essential to understand what's happening in The Bahamas' real estate market. Knowing the most important data, such as median and average prices, the number of properties sold, the number of new listings, and the days on the market will better prepare you for selling or buying.
We are happy to share our October 2024 analysis of the Nassau and Paradise Island market. We also encourage you to review our quarterly market reports on Abaco, Eleuthera, Exuma, Grand Bahama and New Providence.
Our market reports provide Morley's interpretation of the data from the Bahamas Real Estate Association MLS. Even though the MLS does not include all real estate sales and related real estate data, we believe the MLS data is reasonable and consistent to be reliable to use to estimate local real estate trends.

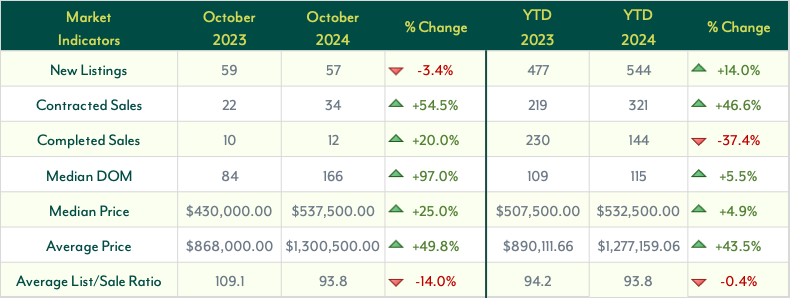
The Nassau and Paradise Island housing market in October 2024 is marked by a mix of growing demand and supply constraints, with notable changes in several key metrics compared to last year.
The number of New Listings saw a slight decrease of 3.4% YoY, dropping to 57 listings, although YTD figures show a 14.0% increase. This uptick year-to-date suggests ongoing interest in the market, but limited new inventory may lead to heightened competition among buyers.
Contracted Sales surged by 54.5% YoY in October 2024, reaching 34. This trend is mirrored YTD, with a 46.6% rise, indicating robust buyer activity. However, the number of Completed Sales increased only modestly by 20.0% YoY, rising to 12, while YTD completed sales saw a decline of 37.4%, likely impacted by the limited availability of move-in-ready properties.
The Median Days on Market (DOM) almost doubled, rising by 97.0% YoY to 166 days, signaling longer sales processes in October 2024. YTD figures show a smaller increase of 5.5%, averaging 115 days. This extended DOM may reflect a slowdown in transaction speed, possibly due to rising prices and more deliberate buyer decisions.
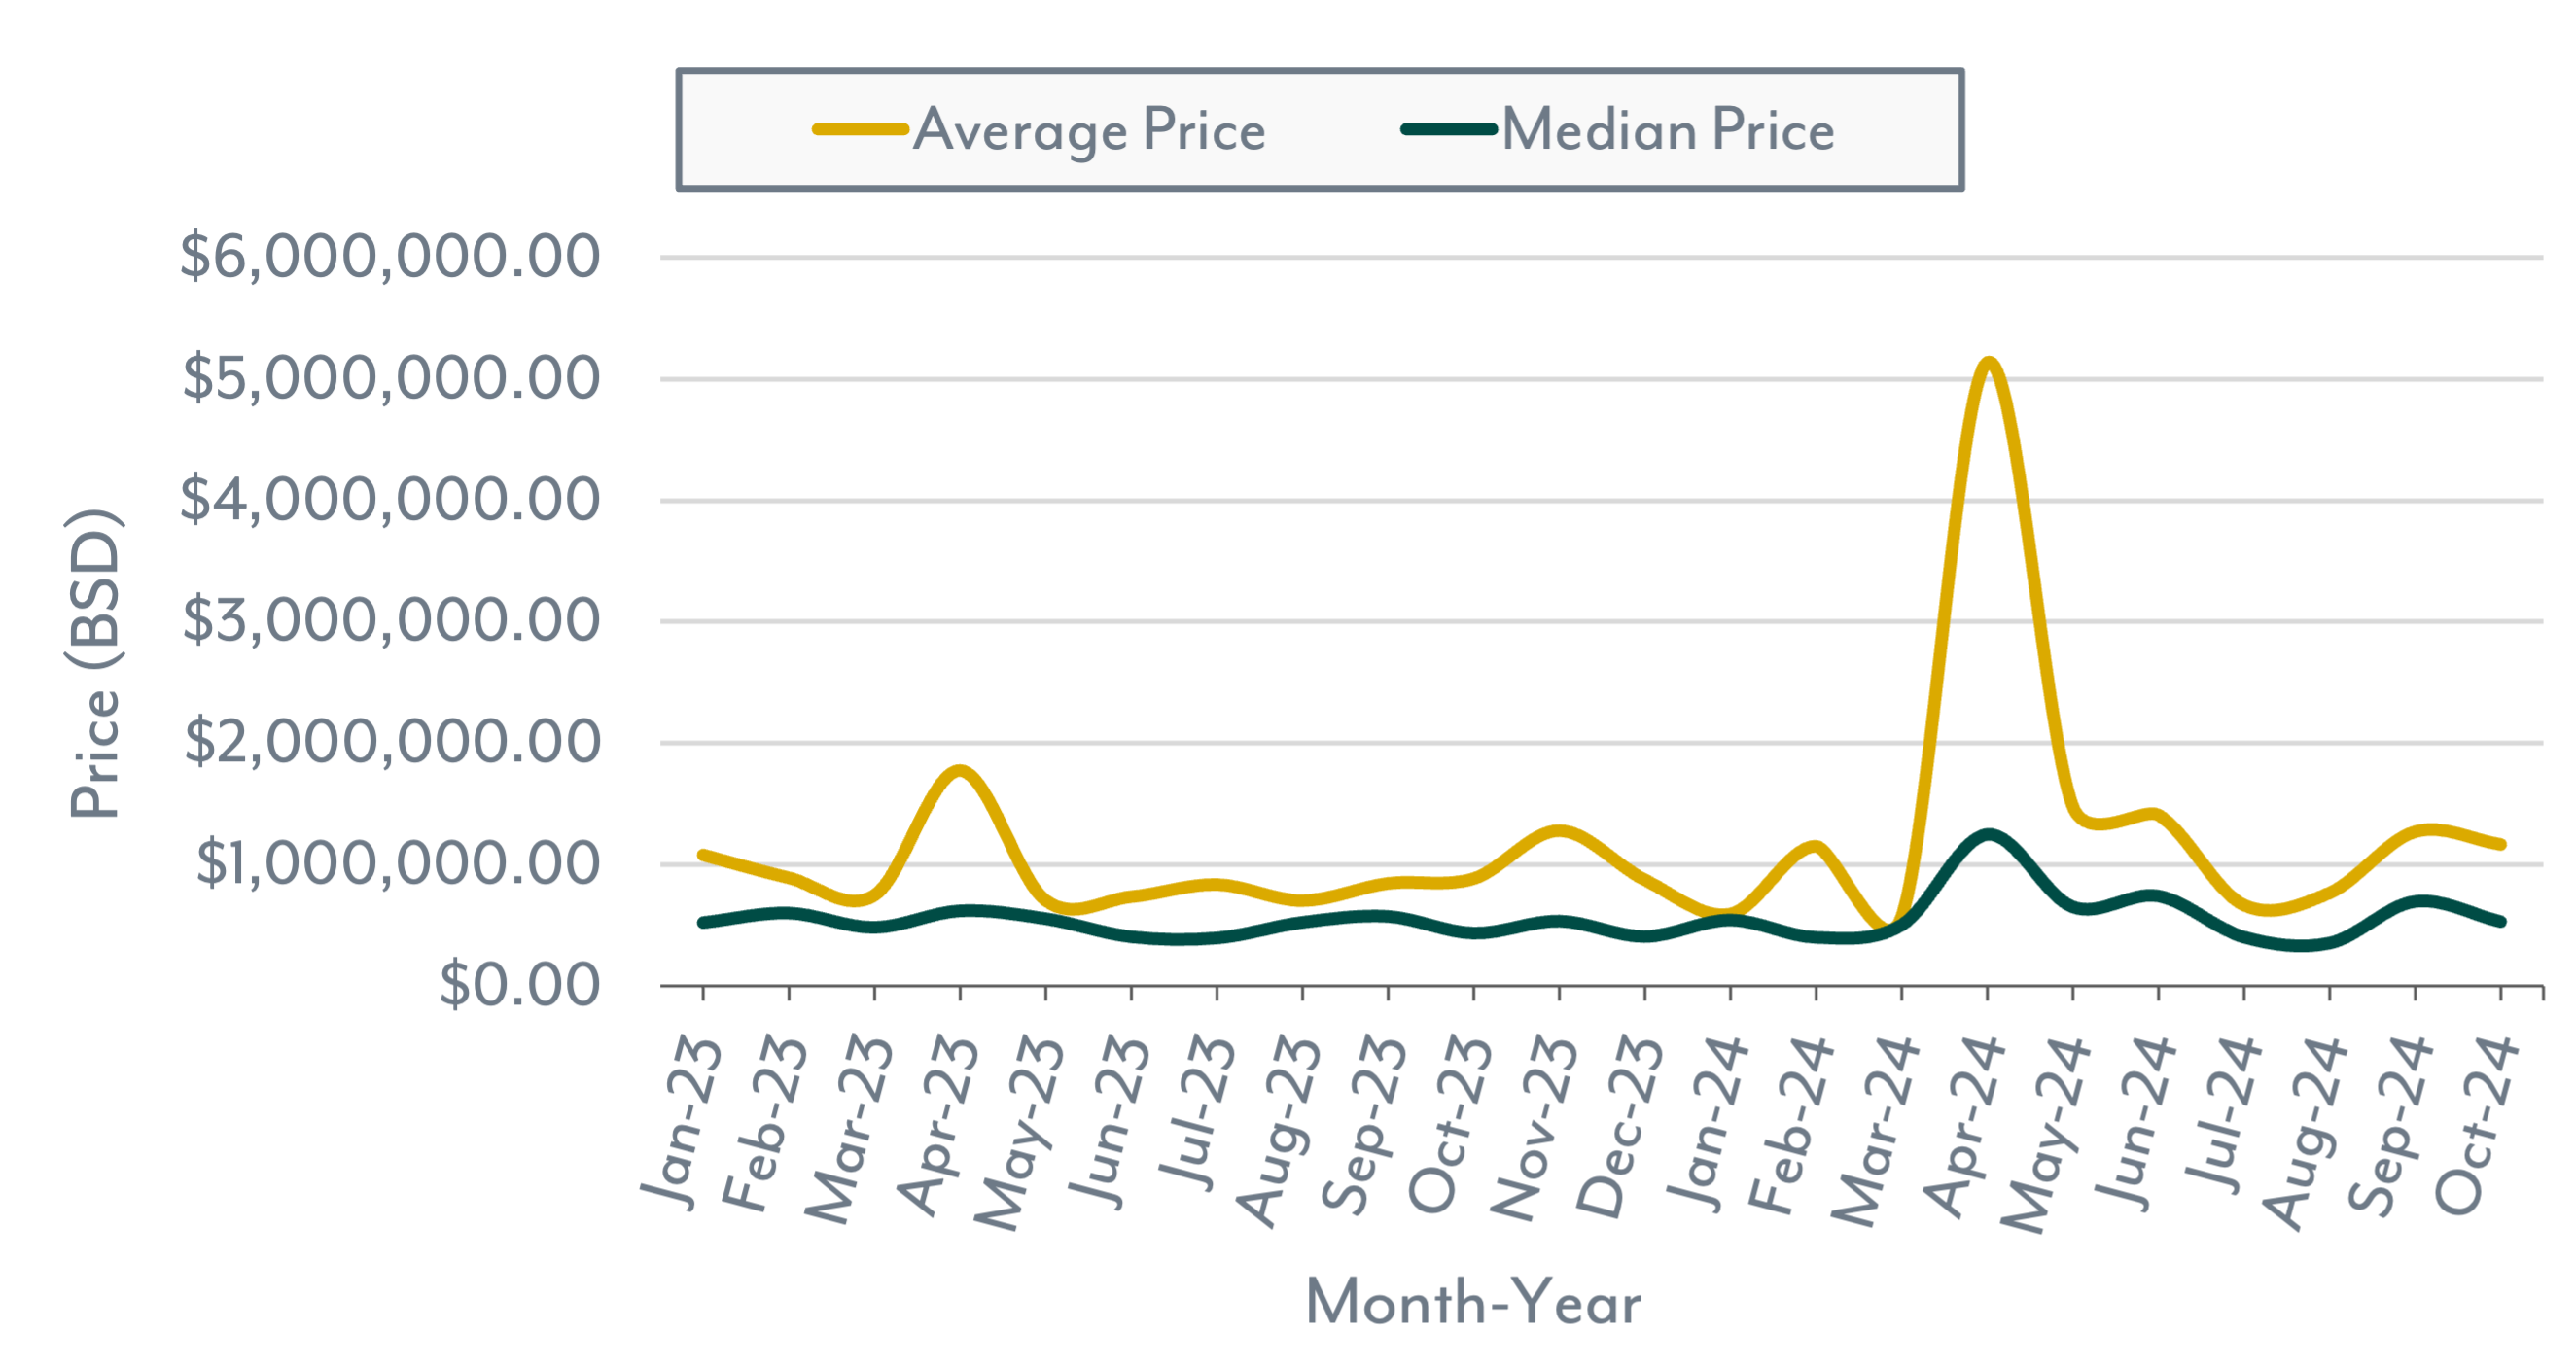
In terms of pricing, the Median Price climbed by 25.0% YoY to $537,500.00 in October 2024, and the Average Price jumped by 49.8% to $1,300,500.00, both signaling strong price growth in the market. YTD, the Median Price is up 4.9% and the Average Price has risen 43.5%, underscoring the premium buyers are willing to pay despite limited supply.
Finally, the Average List-to-Sale Ratio dropped by 14.0% YoY to 93.8, suggesting that buyers are negotiating more on prices, possibly due to higher starting prices. YTD, this ratio is down slightly by 0.4%, indicating that the market is seeing some flexibility in final sales prices.
Home Market Indicators
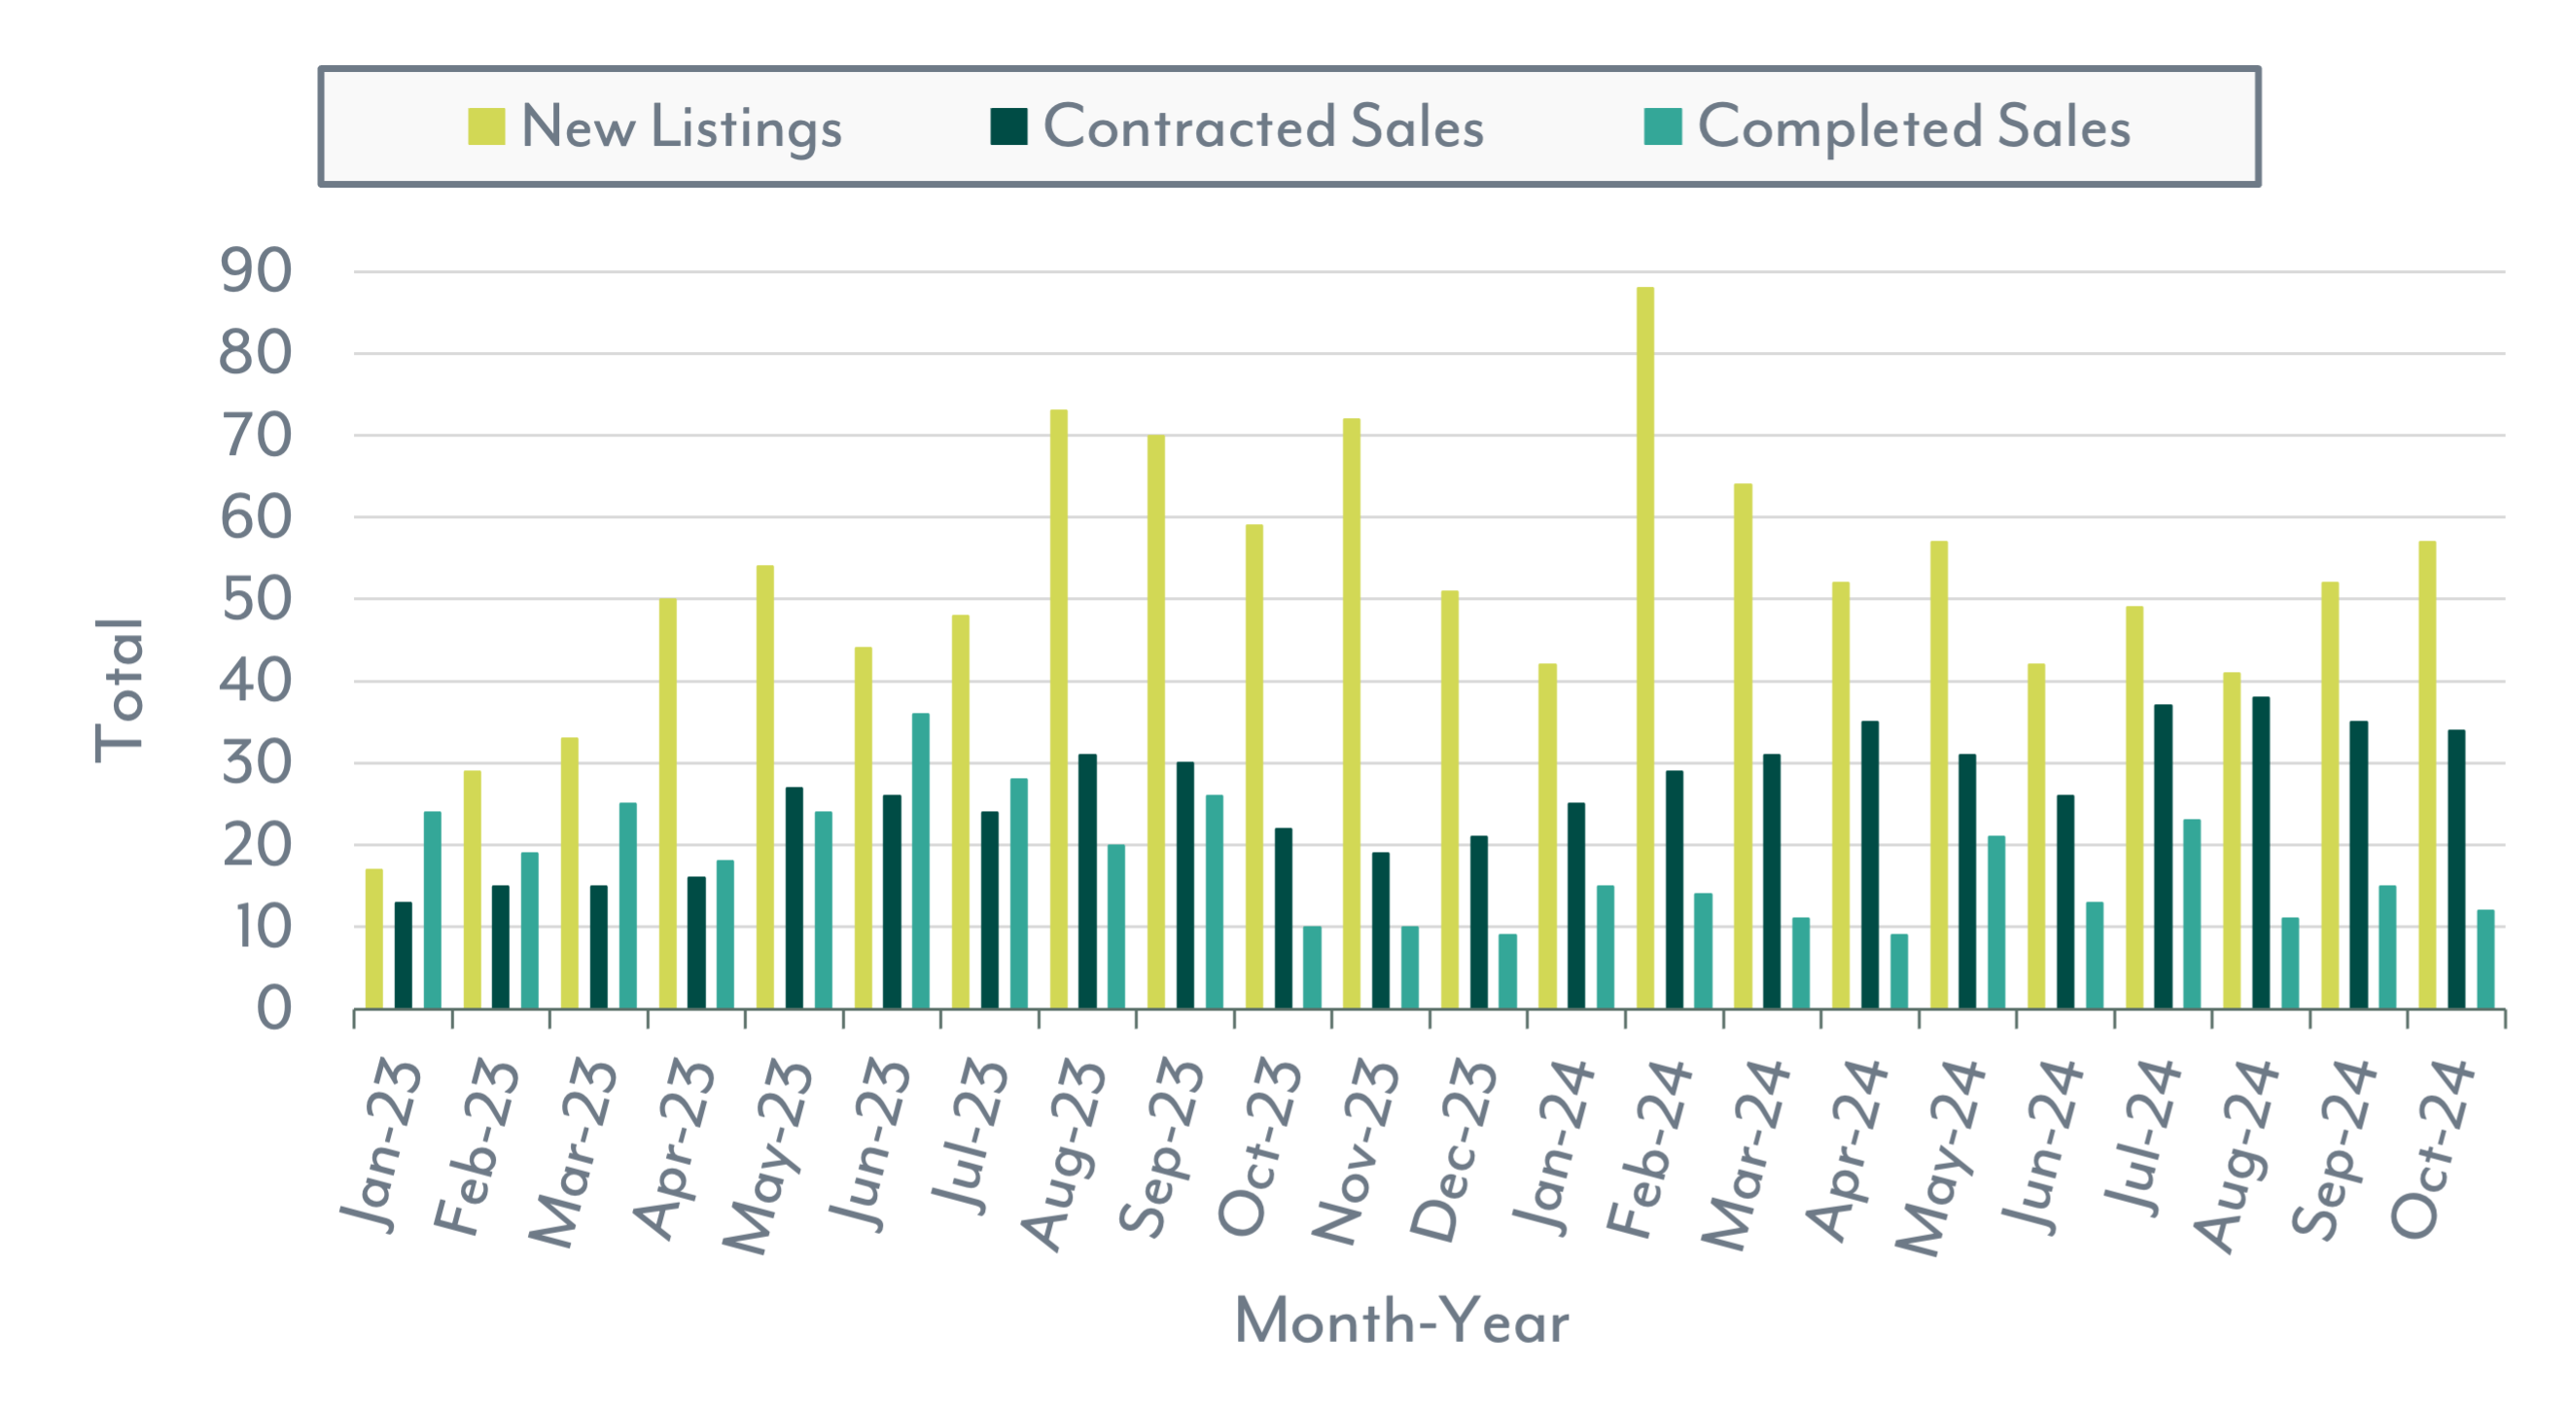
New Listings, Contracted Sales & Completed Sales
Average & Median Price

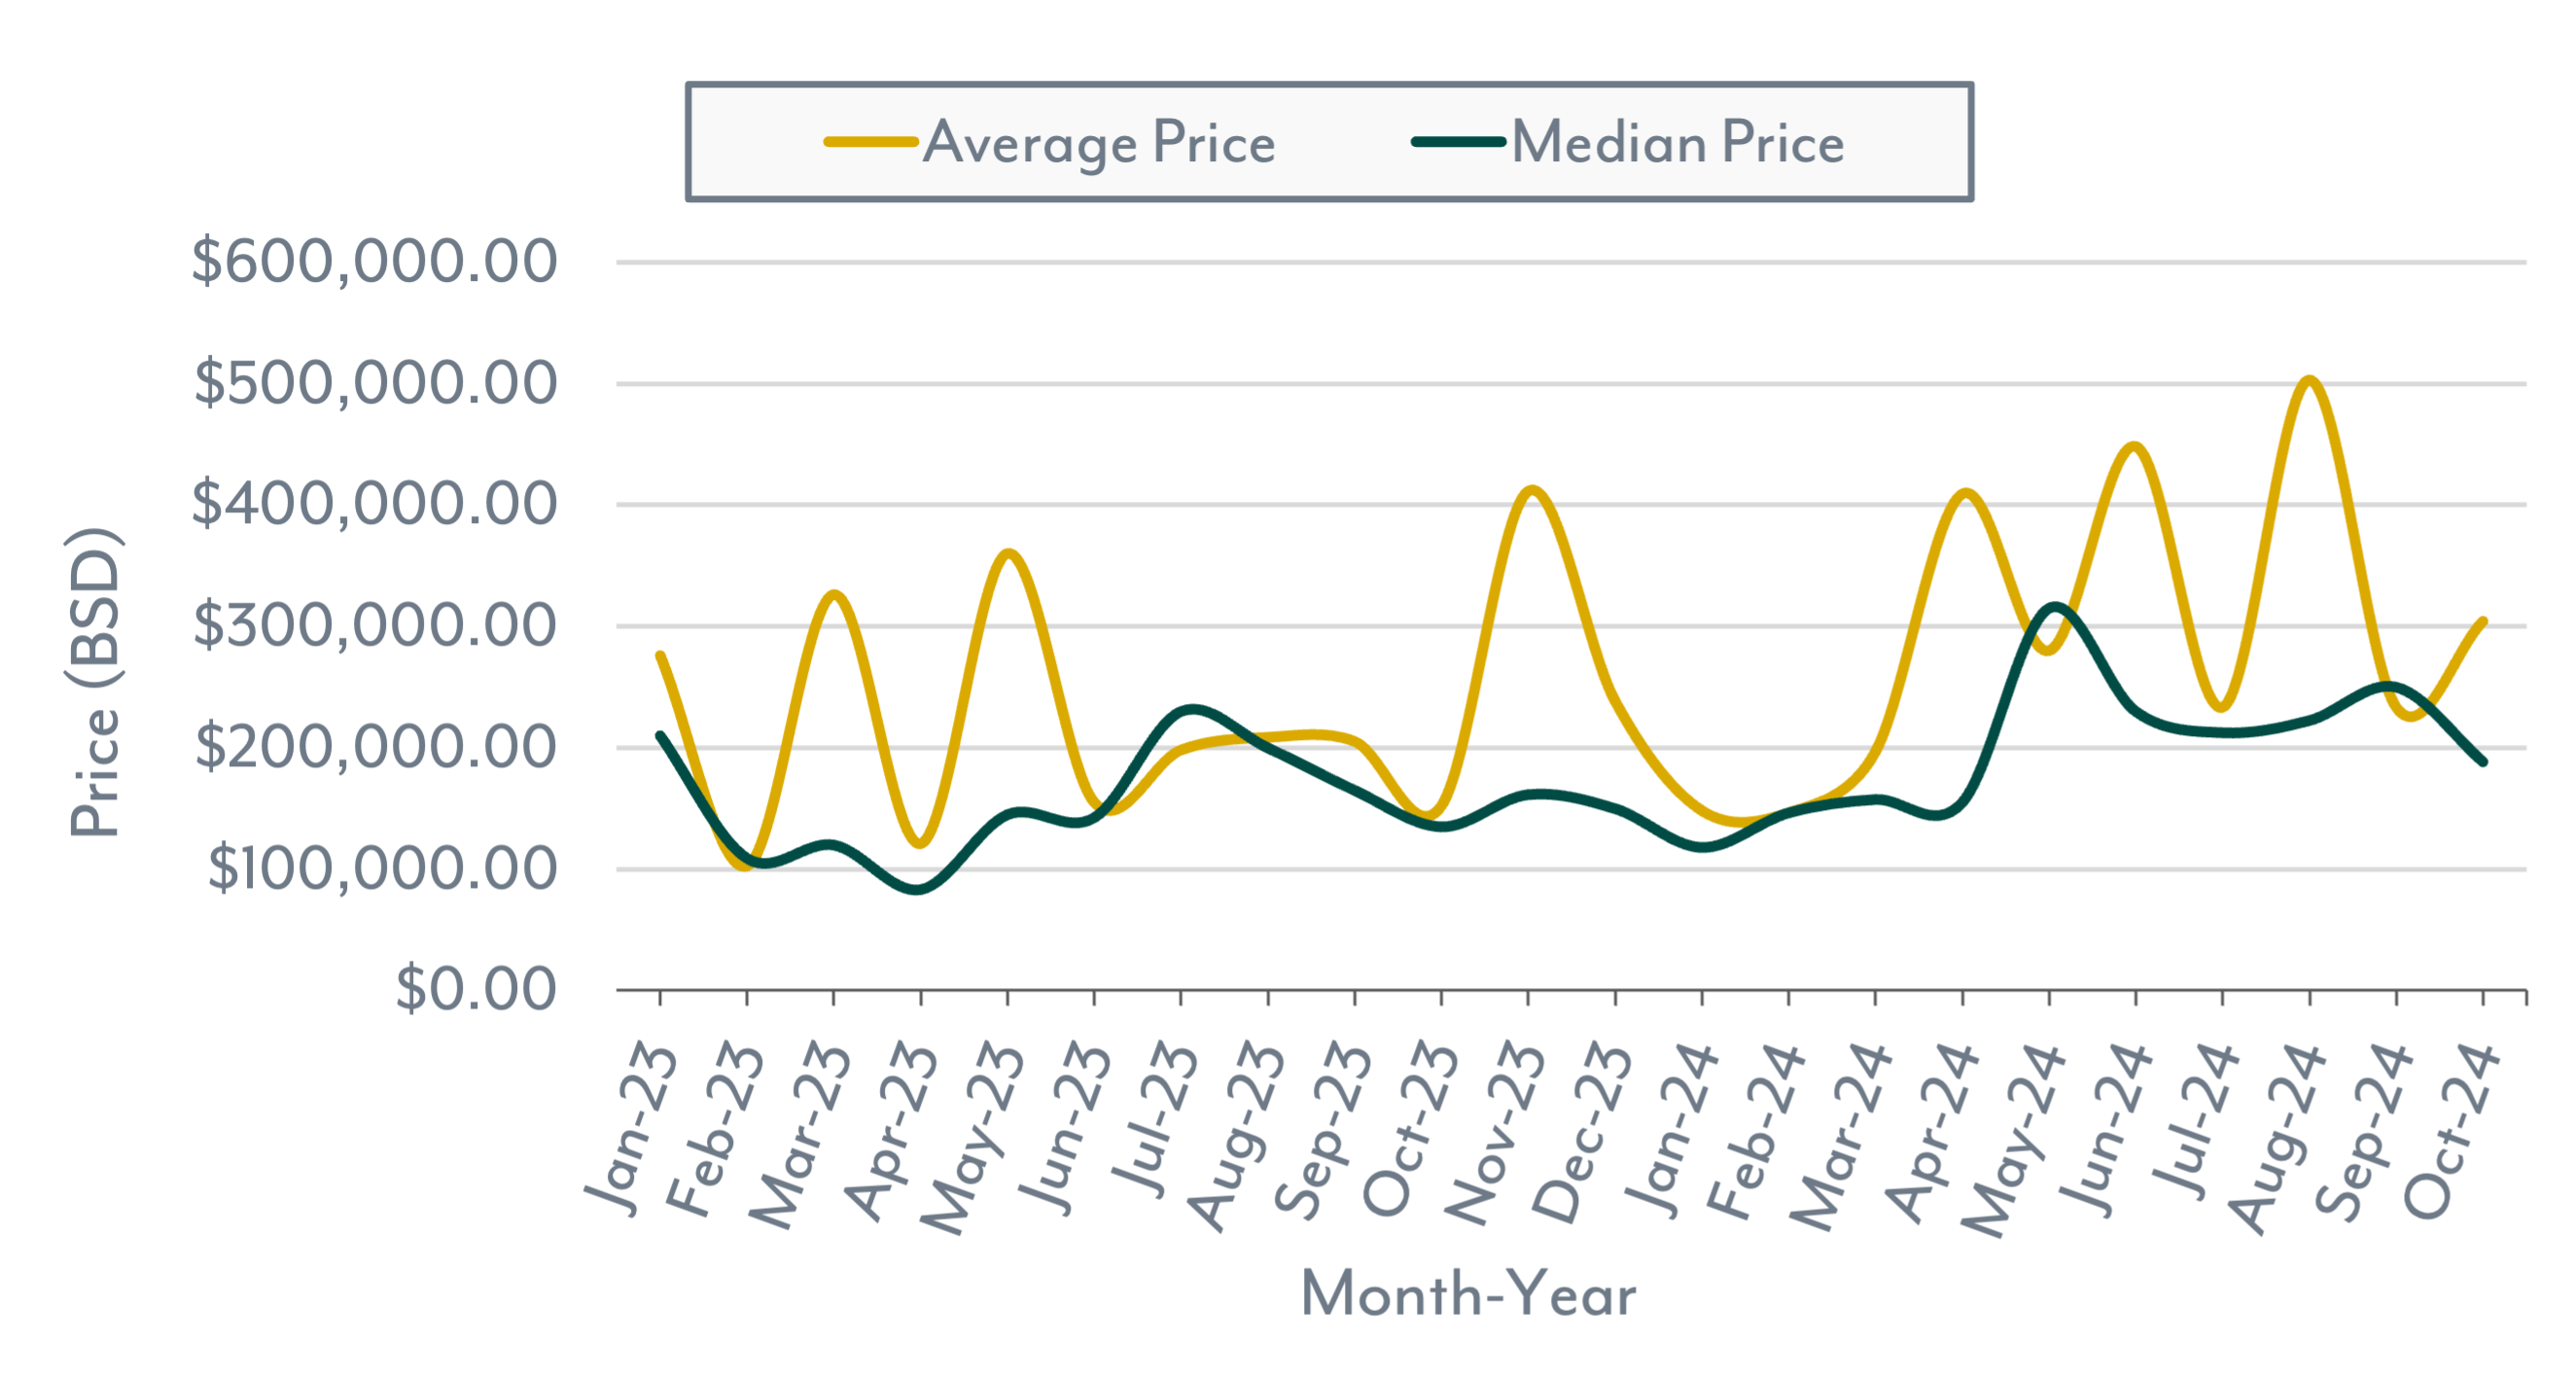
The Nassau and Paradise Island land market showed several significant changes in October 2024, reflecting both strong buyer interest and ongoing shifts in inventory levels.
The number of New Listings fell by 26.2% YoY to 31 in October 2024, a contrast to last month’s increase. However, YTD New Listings have still grown by 15.3%, indicating that while October saw a decrease in fresh inventory, the broader trend for 2024 remains positive for new listings.
Contracted Sales rose sharply by 64.7% YoY to 28, and YTD figures show a substantial increase of 101.0%, highlighting the consistent demand for land throughout the year as more buyers are actively entering into contracts.
The number of Completed Sales doubled YoY to 12 in October 2024, representing a 100.0% increase. This metric also shows a YTD increase of 38.6%, indicating that more transactions are successfully closing, even as inventory constraints appear to impact other aspects of the market.
The Median Days on Market (DOM) decreased significantly by 44.9% YoY to 147 days in October 2024, suggesting that properties are selling much faster than in October 2023. However, the YTD Median DOM has dropped by only 10.2%, averaging 114 days, showing that while October was notably faster, the overall market speed in 2024 has only modestly improved.
Prices continue to climb, with the Median Price rising by 39.6% YoY to $188,500.00. YTD, the Median Price has grown by 39.3%, suggesting sustained price growth across the land market. Additionally, the Average Price almost doubled YoY to $304,125.00, a 99.9% increase, and is up 43.6% YTD, indicating that buyers are paying more for available land, possibly driven by demand for higher-value properties.
The Average List-to-Sale Price Ratio declined by 28.8% YoY, falling to 218.5 in October 2024. This significant drop could suggest that sellers are adjusting their expectations or that negotiation margins have widened. Despite this decline, the YTD ratio has seen a slight increase of 1.2%, averaging 96.1, implying overall stability in how close final prices are to initial listing prices.
Land Market Indicators

New Listings, Contracted Sales & Completed Sales

Average & Median Price
Not sure if you are ready to buy or sell?
We're able to explain what these numbers mean for you and better guide you to make an informed decision that is best for you based on the current market conditions.



.png)

